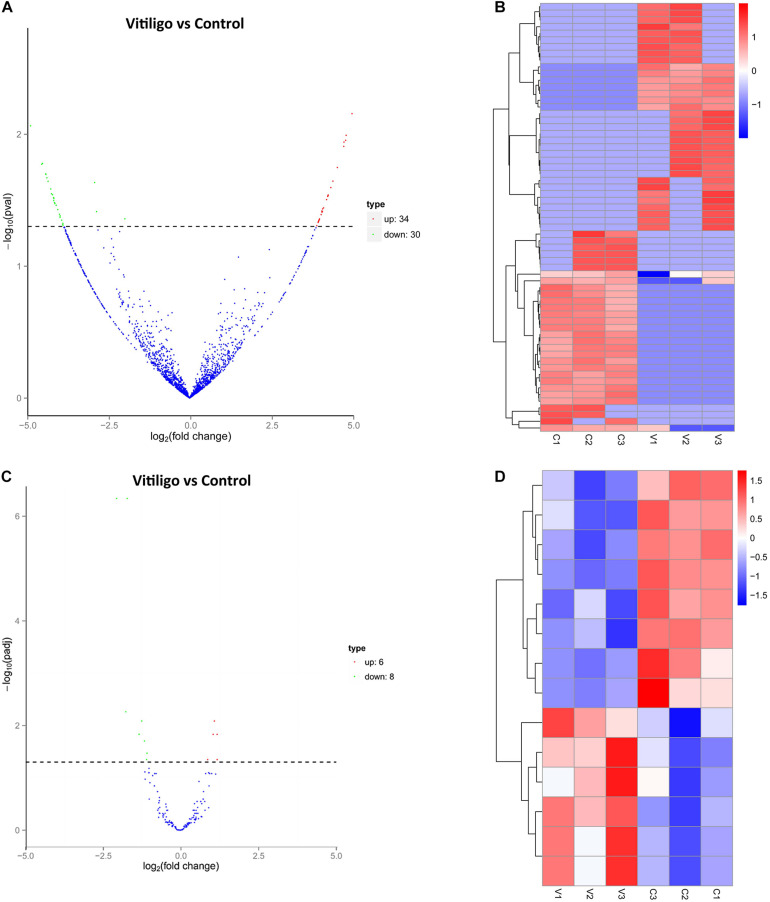
FIGURE 1.
Expression Profiles of dysregulated circRNAs and miRNAs. (A) Volcanoplot of circRNAs. Green, red, and blue points represent circRNAs that were downregulated, upregulated, and not significantly different in vitiligo relative to normal control. (B) Cluster analysis of expression of circRNAs. Red represent increased expression, blue represent decreased expression. (C) Volcanoplot of miRNAs. Green, red and blue points represent miRNAs that were downregulated, upregulated, and not significantly different in vitiligo relative to normal control. (D) Cluster analysis of expression of miRNAs. Red represent increased expression, blue represent decreased expression.

