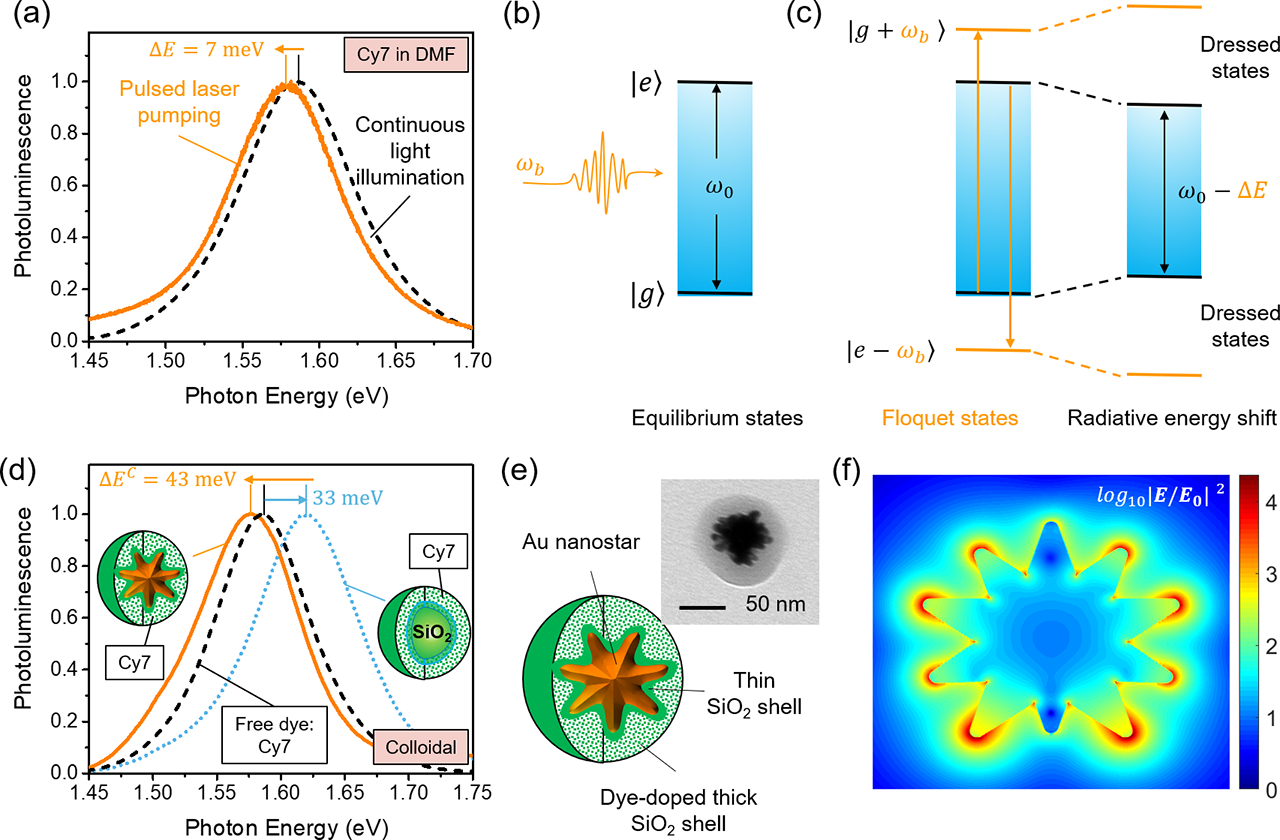
Figure 1. Observation of molecular radiative energy shifts.

(a) Observation of radiative energy shift (ΔE = 7 meV) of Cy7 dye spectral profiles in dimethylformamide (DMF) under pulsed laser pumping (with an excitation wavelength of 680 nm, a pulse repetition rate of 20 Hz, a pulse duration of ~6 ns, and an energy density of about 30 mJ/cm2) when compared to that under continuous illumination of a monochromatic light at 680 nm with a power density of ~0.5 mW/cm2. (b) Schematic of an oscillating bosonic field with an oscillating frequency of ωb and a two-level |g⟩ and |e⟩ atomic system in the equilibrium states with a transition frequency of ω0. (c) Coherent coupling between the equilibrium atomic states |g⟩ and |e⟩ with the Floquet states |e − ωb⟩ and |g + ωb⟩ that contributes to energy shift. (d) Observation of radiative energy shift (ΔEC = 43 meV) for the spectral profiles of an optical nanoprobe made of colloidal Au nanostar@thin-SiO2@Cy7-SiO2 as compared to the control sample made of colloidal SiO2@thin-SiO2@Cy7-SiO2. The SiO2 core nanoparticle has a similar mean diameter of 60 nm as the Au nanostar. It is noted that there is a radiative energy blue shift of 33 meV for the spectral profiles of the Cy7 molecule after it was made into the colloidal SiO2@thin-SiO2@Cy7-SiO2 nanoparticles. (e) Schematic of the optical nanoprobe: Au nanostar@thin-SiO2@dye-SiO2 core-shell (the inset shows a representative TEM image); (f) The electric field distribution averaged from two orthogonal polarizations perpendicular to the shown cross section for a single gold nanostar calculated by finite-difference time-domain (FDTD) simulations at the peak plasmon resonance wavelength.
