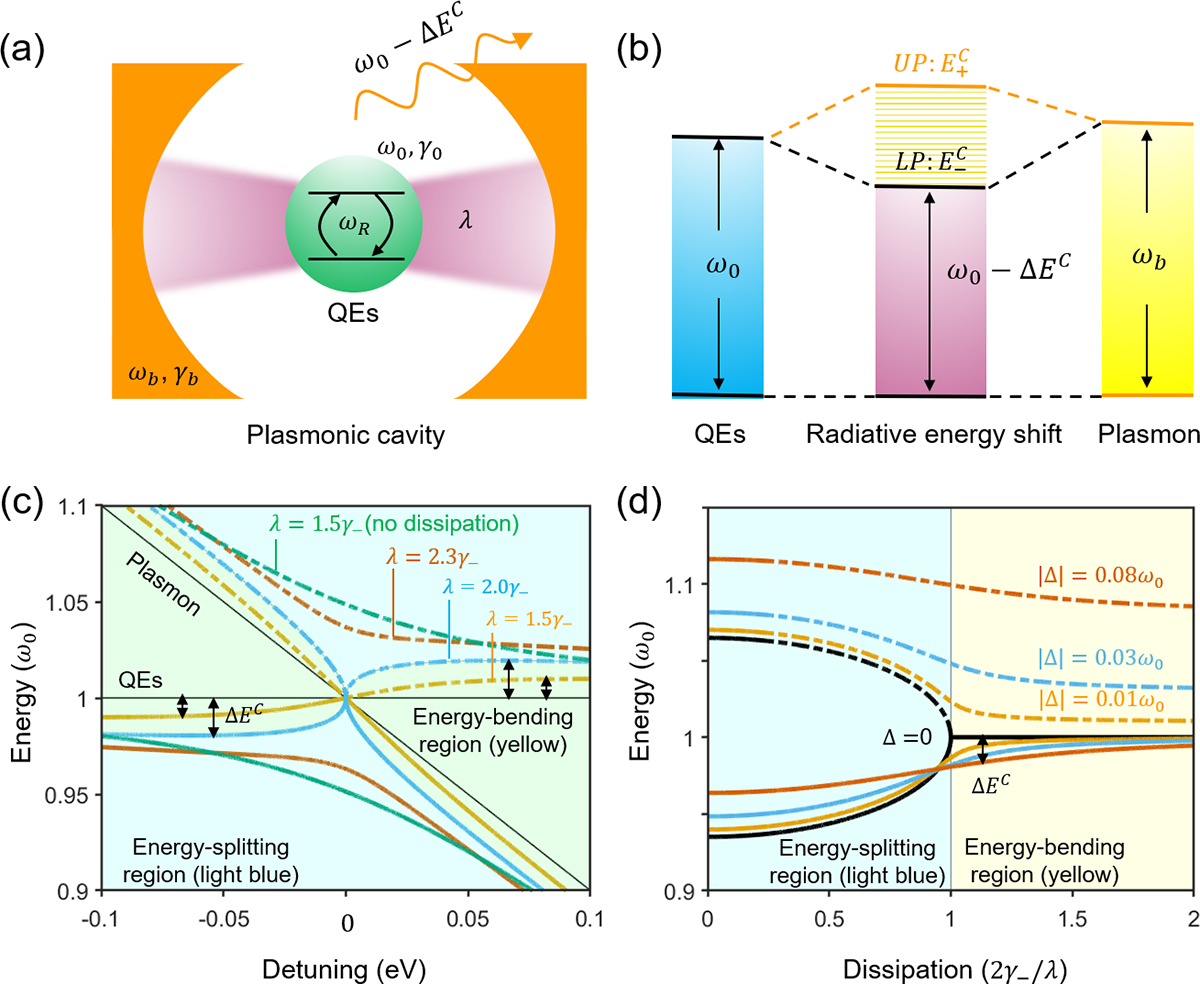
Figure 5. Energy splitting and bending behaviors for the coupled plasmon-QEs system with dissipation.

(a) Schematic representation of the QED system comprising of a two-level atomic system representing QEs with a transition frequency ω0 and decay rate γ0 coherently interacting with a single mode of the oscillating bosonic field in a plasmonic cavity with a resonant frequency ωb and dissipation rate γb. The effective coupling strength is λ. (b) Energy diagram of the system featuring two plexcitonic states (UP and LP) with the energy eigenvalues of . (c) Energy levels of the system as a function of the energy detuning Δ = ω0 − ωb for different coupling strengths as marked. The two thin black lines are the bare atomic and plasmonic states. (d) Energy levels of the system as a function of the energy dissipation γ− for different energy detuning. At zero detuning Δ = 0, the threshold for Rabi splitting occurs at γ−/(2λ)=1. In (c) and (d), the dash-dot lines represent upper plexcitonic states while the solid represent lower plexcitonic states. Yellow-shaded area: an energy-bending region where no energy splitting is allowed; instead, the energy level of QEs undergoes an energy shift of ΔEC owing to the perturbation of the plasmonic field. Light blue-shaded area: an energy-splitting region where distinct anti-crossing plexcitonic states are γ− is defined as γ− = |γ0 − γb|/4.
