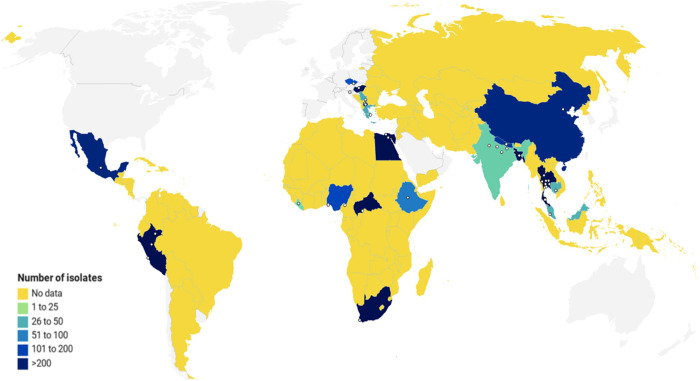
Fig 2. Geographic sources and number of C. jejuni isolates from included studies.
The map depicts LMICs in color according to number of isolates reported. Yellow represents no data (0 isolates), while gradations of blue indicate increasing numbers of isolates. Sampling sites are represented by white dots. Visualization created with Datawrapper.

