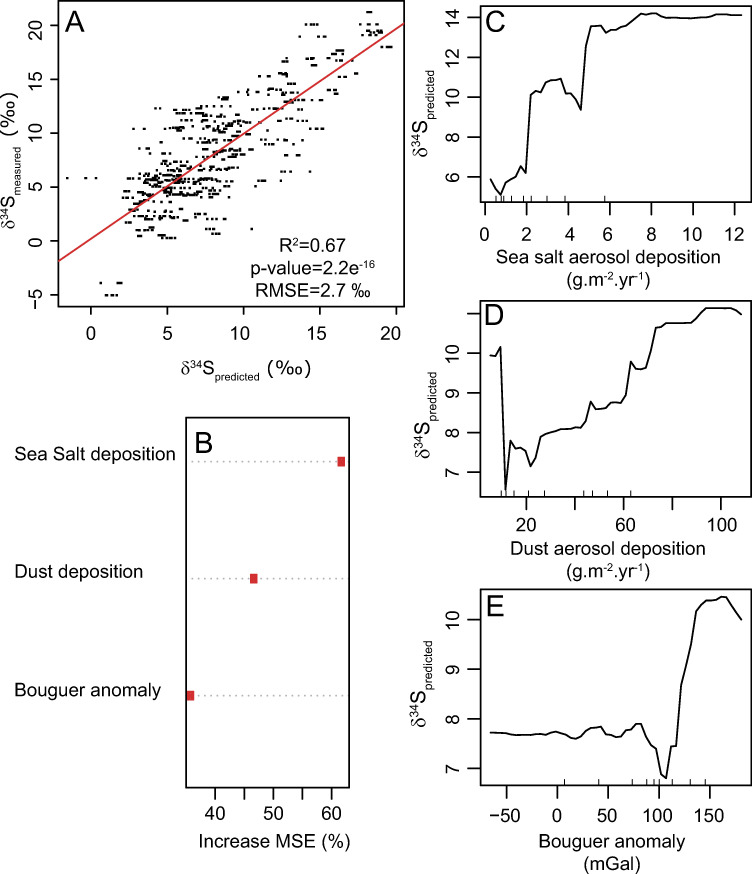
Fig 1. n-fold cross-validation and predictor for the δ34S random forest regression model.
A: 5-fold cross-validation between predicted and measured δ34S values. RMSE = Root Mean Square Error. The red line is the best-fit linear model. B: Variable importance plot showing the increase in mean squared error predictions (estimated with out-of-bag-CV) as a result of the variable being permuted. Higher importance values indicate more weight as a predictor. C-E: Partial dependence plots showing the relation between each selected predictor on the predicted δ34S values. The R script to generate these figures is available in S1 Script.

