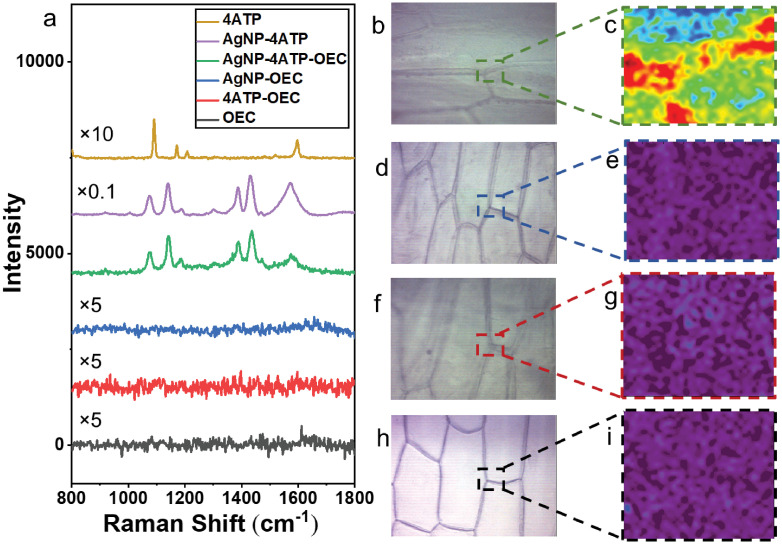
Fig 4. The Raman spectra and Raman images of samples with different treatments.
The typical Raman spectra collected from bulk 4ATP, AgNP-4ATP complex, AgNP-4ATP-OEC, AgNP-OEC, 4ATP-OEC and freshly peeled OEC (a). The optical images and Raman images of scanned area created from AgNP-4ATP-OEC (b),(c), AgNP-OEC (d), (e), 4ATP-OEC (f), (g) freshly peeled OEC (h), (i), respectively. The Raman images were created with the 4ATP-AgNP complex signature peak at 1573 cm−1. Only the AgNP-4ATP-OEC samples produced images with good resolution.

