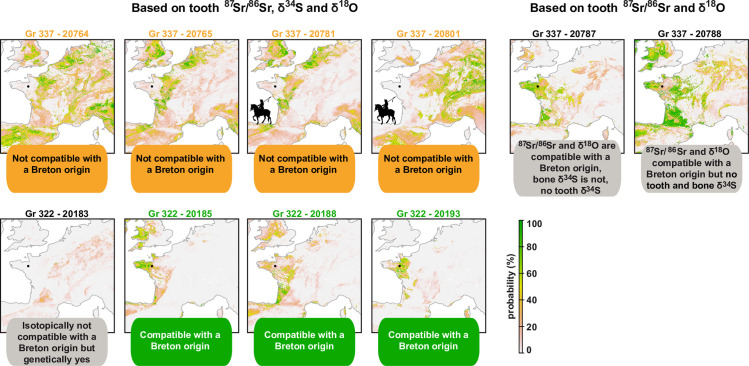
Fig 6. Maps showing the probability of childhood origin of all individuals for which teeth were available in the mass graves.
Maps of possible geographical origins are calculated by comparing predicted isotope variations on the landscape with isotope analyses from tooth enamel for Sr and O isotopes and from tooth’s collagen for S isotopes [13]. Single, dual and triple isotope geographic assignments were performed for each individual but only the results from triple isotope geographic assignments are displayed. For individuals 20787 and 20788, not enough collagen was preserved for analyzing δ34S values and only dual Sr-O isotope geographic assignments are displayed.

