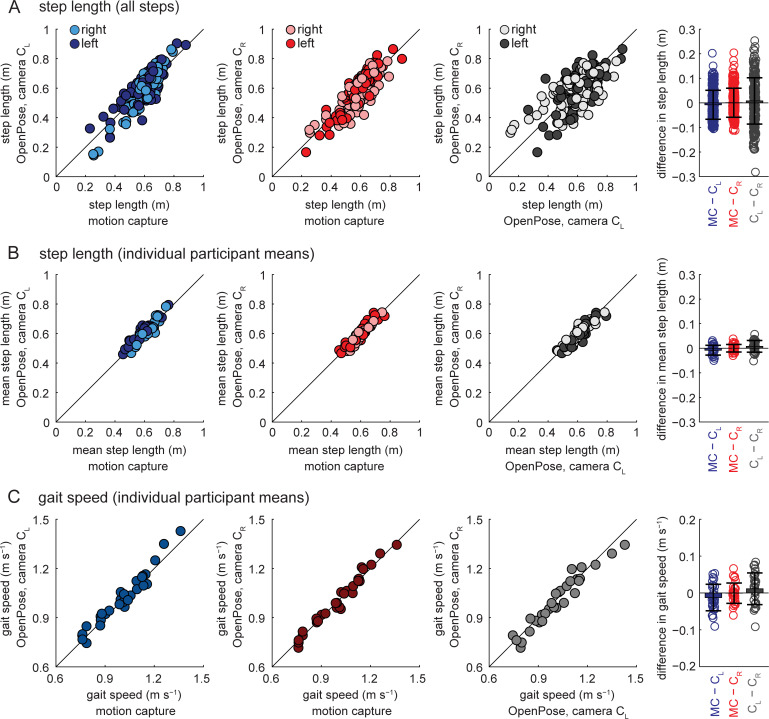
Fig 4. Step length and gait speed comparisons among the different measurement systems.
A) Step lengths calculated for all individual steps for all participants and measurement systems. B) Step lengths calculated as individual participant means for all participants and measurement systems. C) Gait speeds calculated as individual participant means for all participants and measurement systems. Bar plots on the far right show individual data, group means, and SD to visualize the distributions of the differences observed between the measurement systems. Results from statistical analyses are shown in Tables 2–5.

