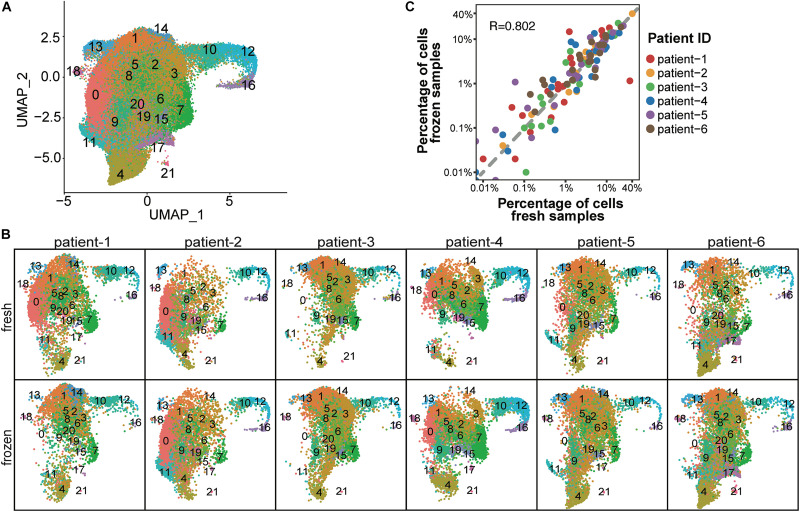
FIGURE 2.
Cellular composition was consistent between fresh and frozen/thawed CD138+ cells. (A) UMAP plot of 37,463 fresh and 49,203 frozen CD138+ cells from 6 MM patient samples, where each cell is grouped into one of 22 clusters. Each cluster is distinguished by a different color and clusters are numbered from 0 to 21. (B) UMAP plots of cells identified in fresh and frozen samples from each patient. Cluster colors and numbers are the same as in (A). (C) Scatter plot of the percentage of cells in each cluster in fresh samples (x-axis) vs. frozen samples (y-axis). Each dot represents one of 22 clusters; the color indicates a different patient.

