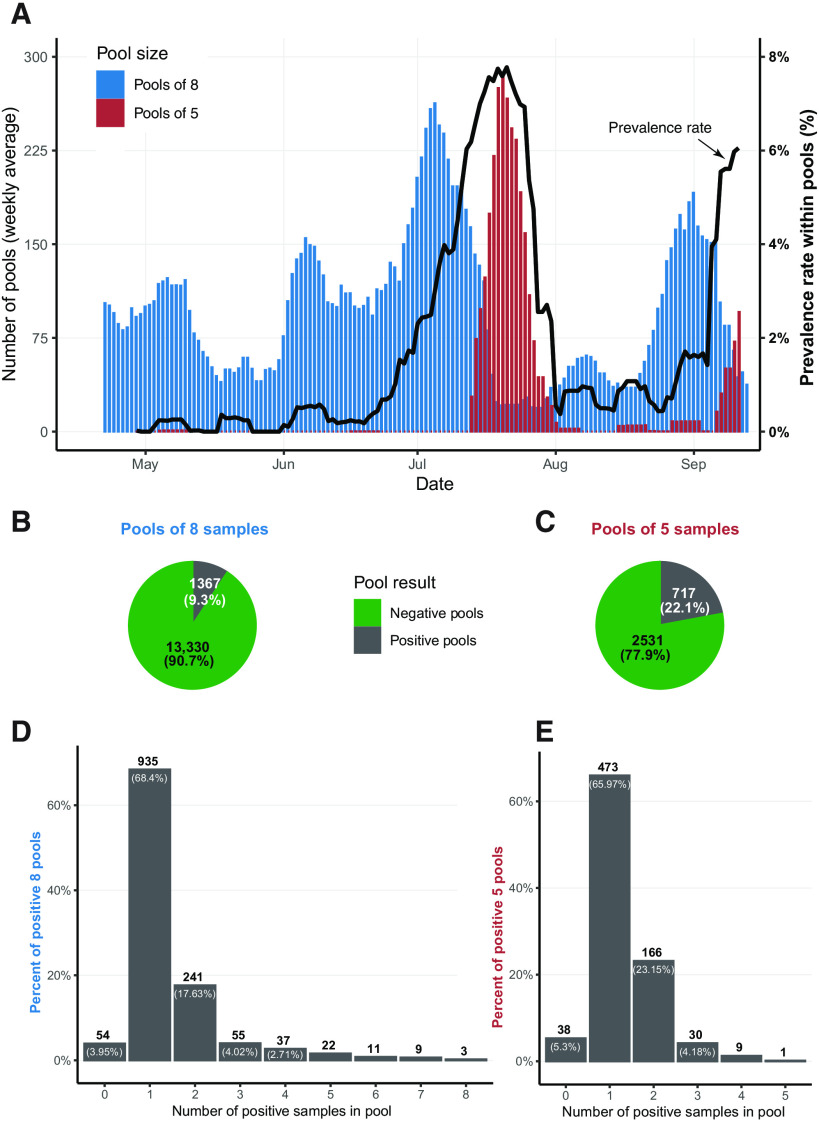
Fig. 1. Overall statistics of pool sizes of eight and five.
(A) Weekly average of eight-sample (blue) and five-sample (red) pools counts, together with the weekly average of the prevalence rate among pooled samples (black). (B and C) Pool results for eight-sample (B) and five-sample (C) pools, respectively. (D and E) Counts of positive pools aggregated by the number of positive samples identified within the pool, for eight-sample (D) and five-sample (E) pools.

