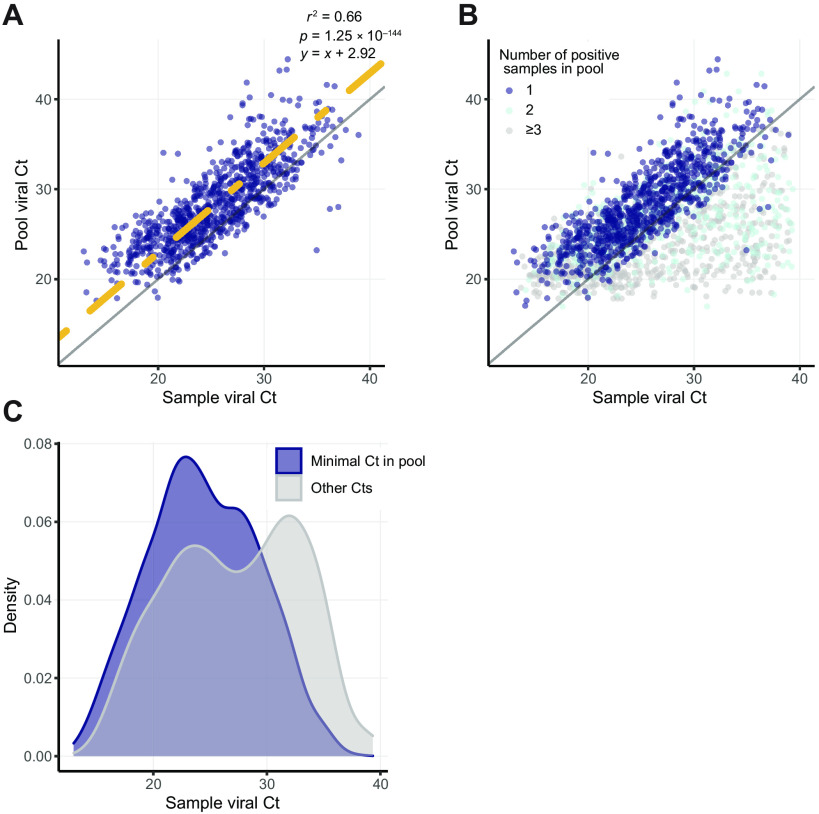
Fig. 2. Comparisons of pool Ct and sample Ct.
(A) Comparison of sample viral Ct (x axis) and pool viral Ct (y axis) for all 935 amplified eight-sample pools with a single positive sample. Linear regression with a predetermined slope of 1 is marked in yellow, and y = x is marked in gray. (B) As in (A), including also pools with 241 two amplified samples (light blue) and 82 three or more positive samples (gray). (C) Distributions of viral Ct values of positive samples in positive pools divided into two groups: samples with the minimal Ct in their pool (blue) and samples with the nonminimal Ct in their pool (gray).

