
Fig. 2. Socioeconomic dimensions of the global wildlife market.
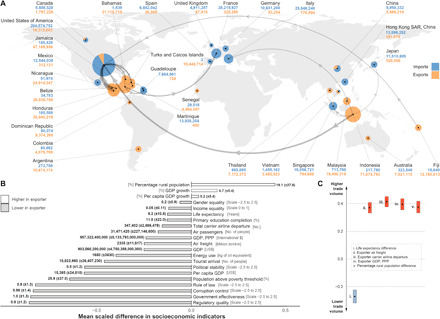
Wild animals in the trade mostly flowed from poor developing economies to rich developed nations/territories, but wealthier exporters are sources of higher trade volumes. (A) Map of the 30 top participants and the 15 largest trade links in the global wild animal trade between 1998 and 2018. The size of the pie charts and width of the arrows are indicative of total individual animals traded, detailed by numbers associated with each participating nation/territory. (B) Bars represent the scaled average difference in socioeconomic indicators between exporters and importers. Actual numerical differences are denoted by the numbers associated with each bar (±SD). (C) Data points represent the scaled posterior distribution of slope coefficients (median ± maximum/minimum value within the 95% credible interval) describing the effects of the top five socioeconomic predictors of bilateral trade volume. The slope coefficients indicate the direction and strength of respective statistical relationships.