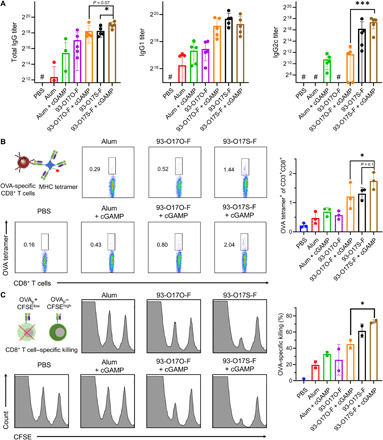
Fig. 4. Enhanced humoral and cellular immune response by codelivery of cGAMP.

(A) The OVA-specific IgG, IgG1, and IgG2c antibody titers after immunization. #The titer was lower than the minimal dilution. n = 5, *P ≤ 0.05, ***P ≤ 0.001. (B) The representative flow images and the quantitated percentages of OVA-peptide (OVAp)–specific CD8+ T cells in spleen of the vaccinated mice. n = 3, *P ≤ 0.05. (C) The representative flow images and the quantitated percentages of OVA-specific killing by CD8+ T cells in spleen of the vaccinated mice. n = 2, *P ≤ 0.05.
