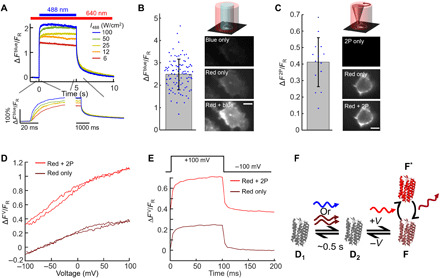
Fig. 1. Photoactivation of paQuasAr3.

(A) Fluorescence response of paQuasAr3 to blue (488 nm) illumination superposed on steady red illumination (640 nm, 90 W/cm2). Representative recording from a single cell. Inset: Magnified views of the fluorescence dynamics when the blue light was applied and removed. (B) In HEK cells expressing paQuasAr3, blue light (488 nm, 12 W/cm2) enhanced red-excited (640 nm, 90 W/cm2) near-infrared fluorescence (n = 95 cells). Right: Images of HEK cell under the three illumination conditions, shown with the same brightness and contrast scales. Scale bars, 10 μm. (C) Same experiment as (B), with the blue light replaced by 3-mW focused 900-nm laser light scanned along the perimeter of the cell (2P) (n = 12 cells). Error bars in (B) and (C) indicate SDs. (D) Voltage response of paQuasAr3 without (brown) and with (red) 2P activation. Fluorescence changes for both traces are measured relative to, and normalized by, fluorescence with red-only illumination at −70 mV (FR). (E) Voltage step response of paQuasAr3 without (brown) and with (red) 2P activation. Fluorescence changes for both traces are measured relative to, and normalized by, fluorescence with red-only illumination at −100 mV (FR). Data in (D) and (E) are representative recordings from n = 4 cells. (F) Model photocycle for photoactivation and voltage sensitivity in paQuasAr3. States D1 and D2 are nonfluorescent. State F can be excited by red light and emits in the near infrared.
