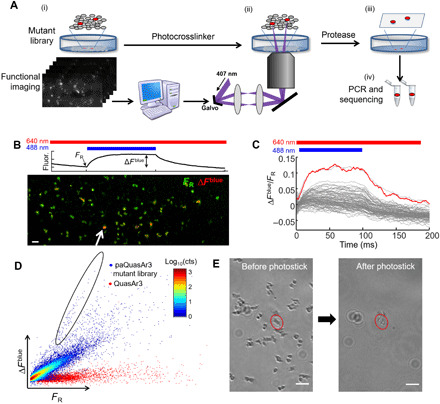
Fig. 2. Screening of NovArch.

(A) Photostick screening protocol (26). (i) In a pooled library of HEK cells expressing mutants of paQuasAr3, wide-field fluorescence measurements probed blue light sensitization of red-excited fluorescence. Cells with large enhancement were identified via automated image processing. (ii) Focused illumination with 407-nm light cross-linked target cells to the dish. (iii) Nontarget cells were removed via a rinse with protease. (iv) The targeted cells were detached by gentle pipetting, and mutant genes were amplified and sequenced. (B) Top: Illumination protocol and parameters calculated for each cell to quantify photoactivation. Bottom: Example field of view comprising HEK cells expressing mutants of paQuasAr3. Most cells expressed nonfluorescent mutants and were not visible. Green, baseline fluorescence FR under red-only illumination (640 nm, 20 W/cm2); red, increase in fluorescence, ∆Fblue, upon photoactivation with 488-nm light, 0.1 W/cm2. Scale bar, 100 μm. (C) Fluorescence responses, ∆Fblue/FR, for individual cells in the field of view shown in (B). Red line shows response of the cell indicated with white arrow in (B). (D) Scatterplot of photoactivation, ∆Fblue, and baseline brightness, FR, for paQuasAr3 mutants across all fields of view and all dishes (blue dots). Control measurements with QuasAr3 showed no photoactivation (red dots). Selected cells (circled region) had high photoactivation contrast (ratio of blue activation to baseline red fluorescence). cts, counts. (E) Photostick selection of a cell expressing a targeted mutant. Left: Culture dish before photostick. Right: Same field of view after cross-linking the target cell to the dish and removing nontarget cells. Scale bars, 100 μm.
