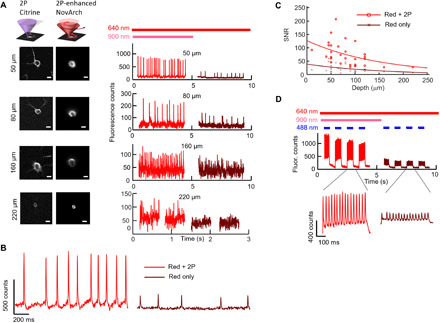
Fig. 6. Depth-resolved voltage imaging and all-optical electrophysiology in acute brain slice.

(A) Left: 2P images of Citrine acquired through conventional raster scanning and 2P-enhanced 1P fluorescence images acquired by scanning both foci along the cell periphery and acquiring fluorescence images on a camera. Scale bars, 10 μm. Right: Using 2P Citrine images to define the cell periphery, 2P and 1P foci were coaligned and scanned around neurons at different depths. The presence of 2P sensitization robustly enhanced fluorescence measurements of action potential amplitude. (B) Optical recording from a cell at a depth of 50 μm. (C) Depth-dependent SNR for single-trial AP detection without and with 2P sensitization. The lines represent fits to an exponential decay function. Paired measurements on n = 29 neurons. (D) Simultaneous optogenetic stimulation and 2P-enhanced NovArch imaging in tissue. Top: Pulses of blue light–excited repetitive spiking. 2P illumination–enhanced spike amplitude and SNR. Bottom: Magnified views of the optically induced spiking with and without 2P enhancement.
