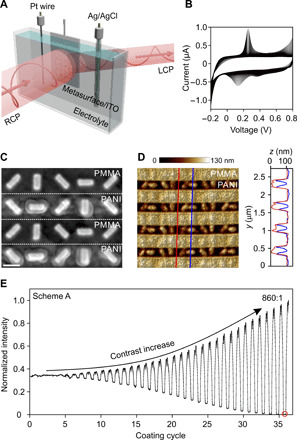
Fig. 2. In situ optimization of the metasurface performance.

(A) Schematic of the experimental setup. The metasurface on ITO (working electrode) is immersed into an electrolyte in a glass cell along with a Pt wire (counter electrode) and a Ag/AgCl reference electrode. Right-handed circularly polarized (RCP) light impinges on the sample at normal incidence, and the anomalous transmission intensity is recorded. (B) Cyclic voltammetry diagram for the electrochemical deposition of PANI on the metasurface sample. A potential range from −0.2 to 0.8 V and a scan speed of 25 mV/s are used. (C) SEM image of the metasurface with the optimized PANI thickness. Scale bar, 200 nm. (D) Atomic force microscopy image of the metasurface and selected height profiles. The measured thickness of PANI coated on the gold nanorods, tPANI, is approximately 50 nm (i.e., h2 = 100 nm). (E) In situ recorded normalized intensity of the anomalous transmission during the PANI growth (scheme A). The electrochemical process is halted when the intensity reaches the minimum (coating cycle 36, red circle). The intensity contrast defined as the ratio between the maximum and minimum intensities is as high as 860:1.
