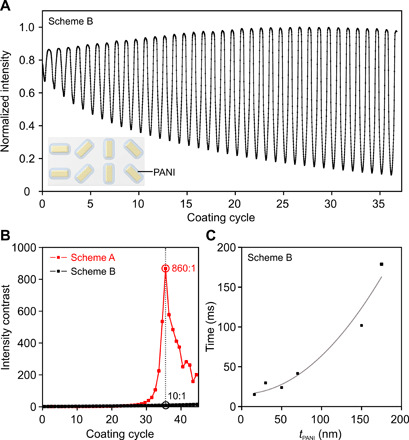
Fig. 4. Control experiment.

(A) In situ recorded normalized intensity of the anomalous transmission during the PANI growth (scheme B). The electrochemical process is halted at a coating cycle number of 36 for a direct comparison with scheme A. Inset, schematic of scheme B, in which all the gold nanorods on the metasurface are conjugated with PANI. The dimensions of the gold nanorods are the same as those in scheme A. (B) Light intensity contrasts (ratio between the maximum and minimum intensities) in dependence on the coating cycle for schemes A (red) and B (black), respectively. (C) Fall time in dependence on the PANI thickness tPANI in scheme B. The fitted curve follows the relation, τ = 0.0048tPANI2 + 12.3. The metasurface switching in scheme B is substantially slowed down for thicker PANI coatings.
