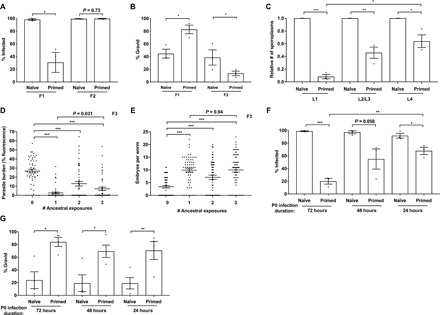
Fig. 3. Inherited immunity in N. parisii primed C. elegans lasts a single generation and is strongest in early larval stages.

(A to C) L1 stage N2 C. elegans were either not infected or infected with a low dose of N. parisii spores for 72 hpi. (A and B) F1 embryo populations were then split and either tested for immunity or maintained under noninfection conditions for the collection and subsequent testing of F2 embryos. F1 and F2 L1 larvae were exposed to a high dose of N. parisii, fixed at 72 hpi, and stained with DY96. (A) Percentage of animals infected. (B) Percentage of worms that are gravid. (C) F1 larvae were challenged with a maximal dose of N. parisii spores at either the L1, L2/L3, or L4 stage; fixed at 30 mpi; and stained with N. parisii 18S RNA FISH probe. Number of sporoplasms per worm. Data pooled from three independent experiments using n = 16 to 20 (A and B) or n = 12 to 20 (C) worms per condition per experiment. (D and E) L1 stage N2 C. elegans (P0, F1, and F2) were infected with N. parisii for 72 hours, for either one, two, or three successive generations (see schematic in fig. S6C). F3 L1 larvae were exposed to a high dose of N. parisii, fixed at 72 hpi, and stained with DY96. (D) Quantitation of DY96 fluorescent spores per worm. (E) Number of embryos per worm. Data pooled from two independent experiments using n = 25 (D) or n = 30 (E) worms per condition per experiment. (F and G) N2 C. elegans were either not infected or infected with a low dose of N. parisii spores at the L1 stage (for 72 hours), L2/L3 stage (for 48 hours), or L4 stage (for 24 hours). F1 worms were infected with N. parisii as in (A). (F) Percentage of worms infected. Data pooled from three independent experiments using n = 100 to 197 worms per condition per experiment. (G) Percentage of worms that are gravid. Data pooled from four independent experiments using n = 100 to 197 worms per condition per experiment. Means ± SEM (horizontal bars) are shown. The P values were determined by unpaired two-tailed Student’s t test. (A, B, and G) Significance was defined as follows: *P < 0.05; **P < 0.01. (C and F) Significance with Bonferroni correction was defined as follows: *P < 0.025; **P < 0.005; ***P < 0.0005. (D and E) Significance with Bonferroni correction was defined as follows: ***P < 0.00033.
