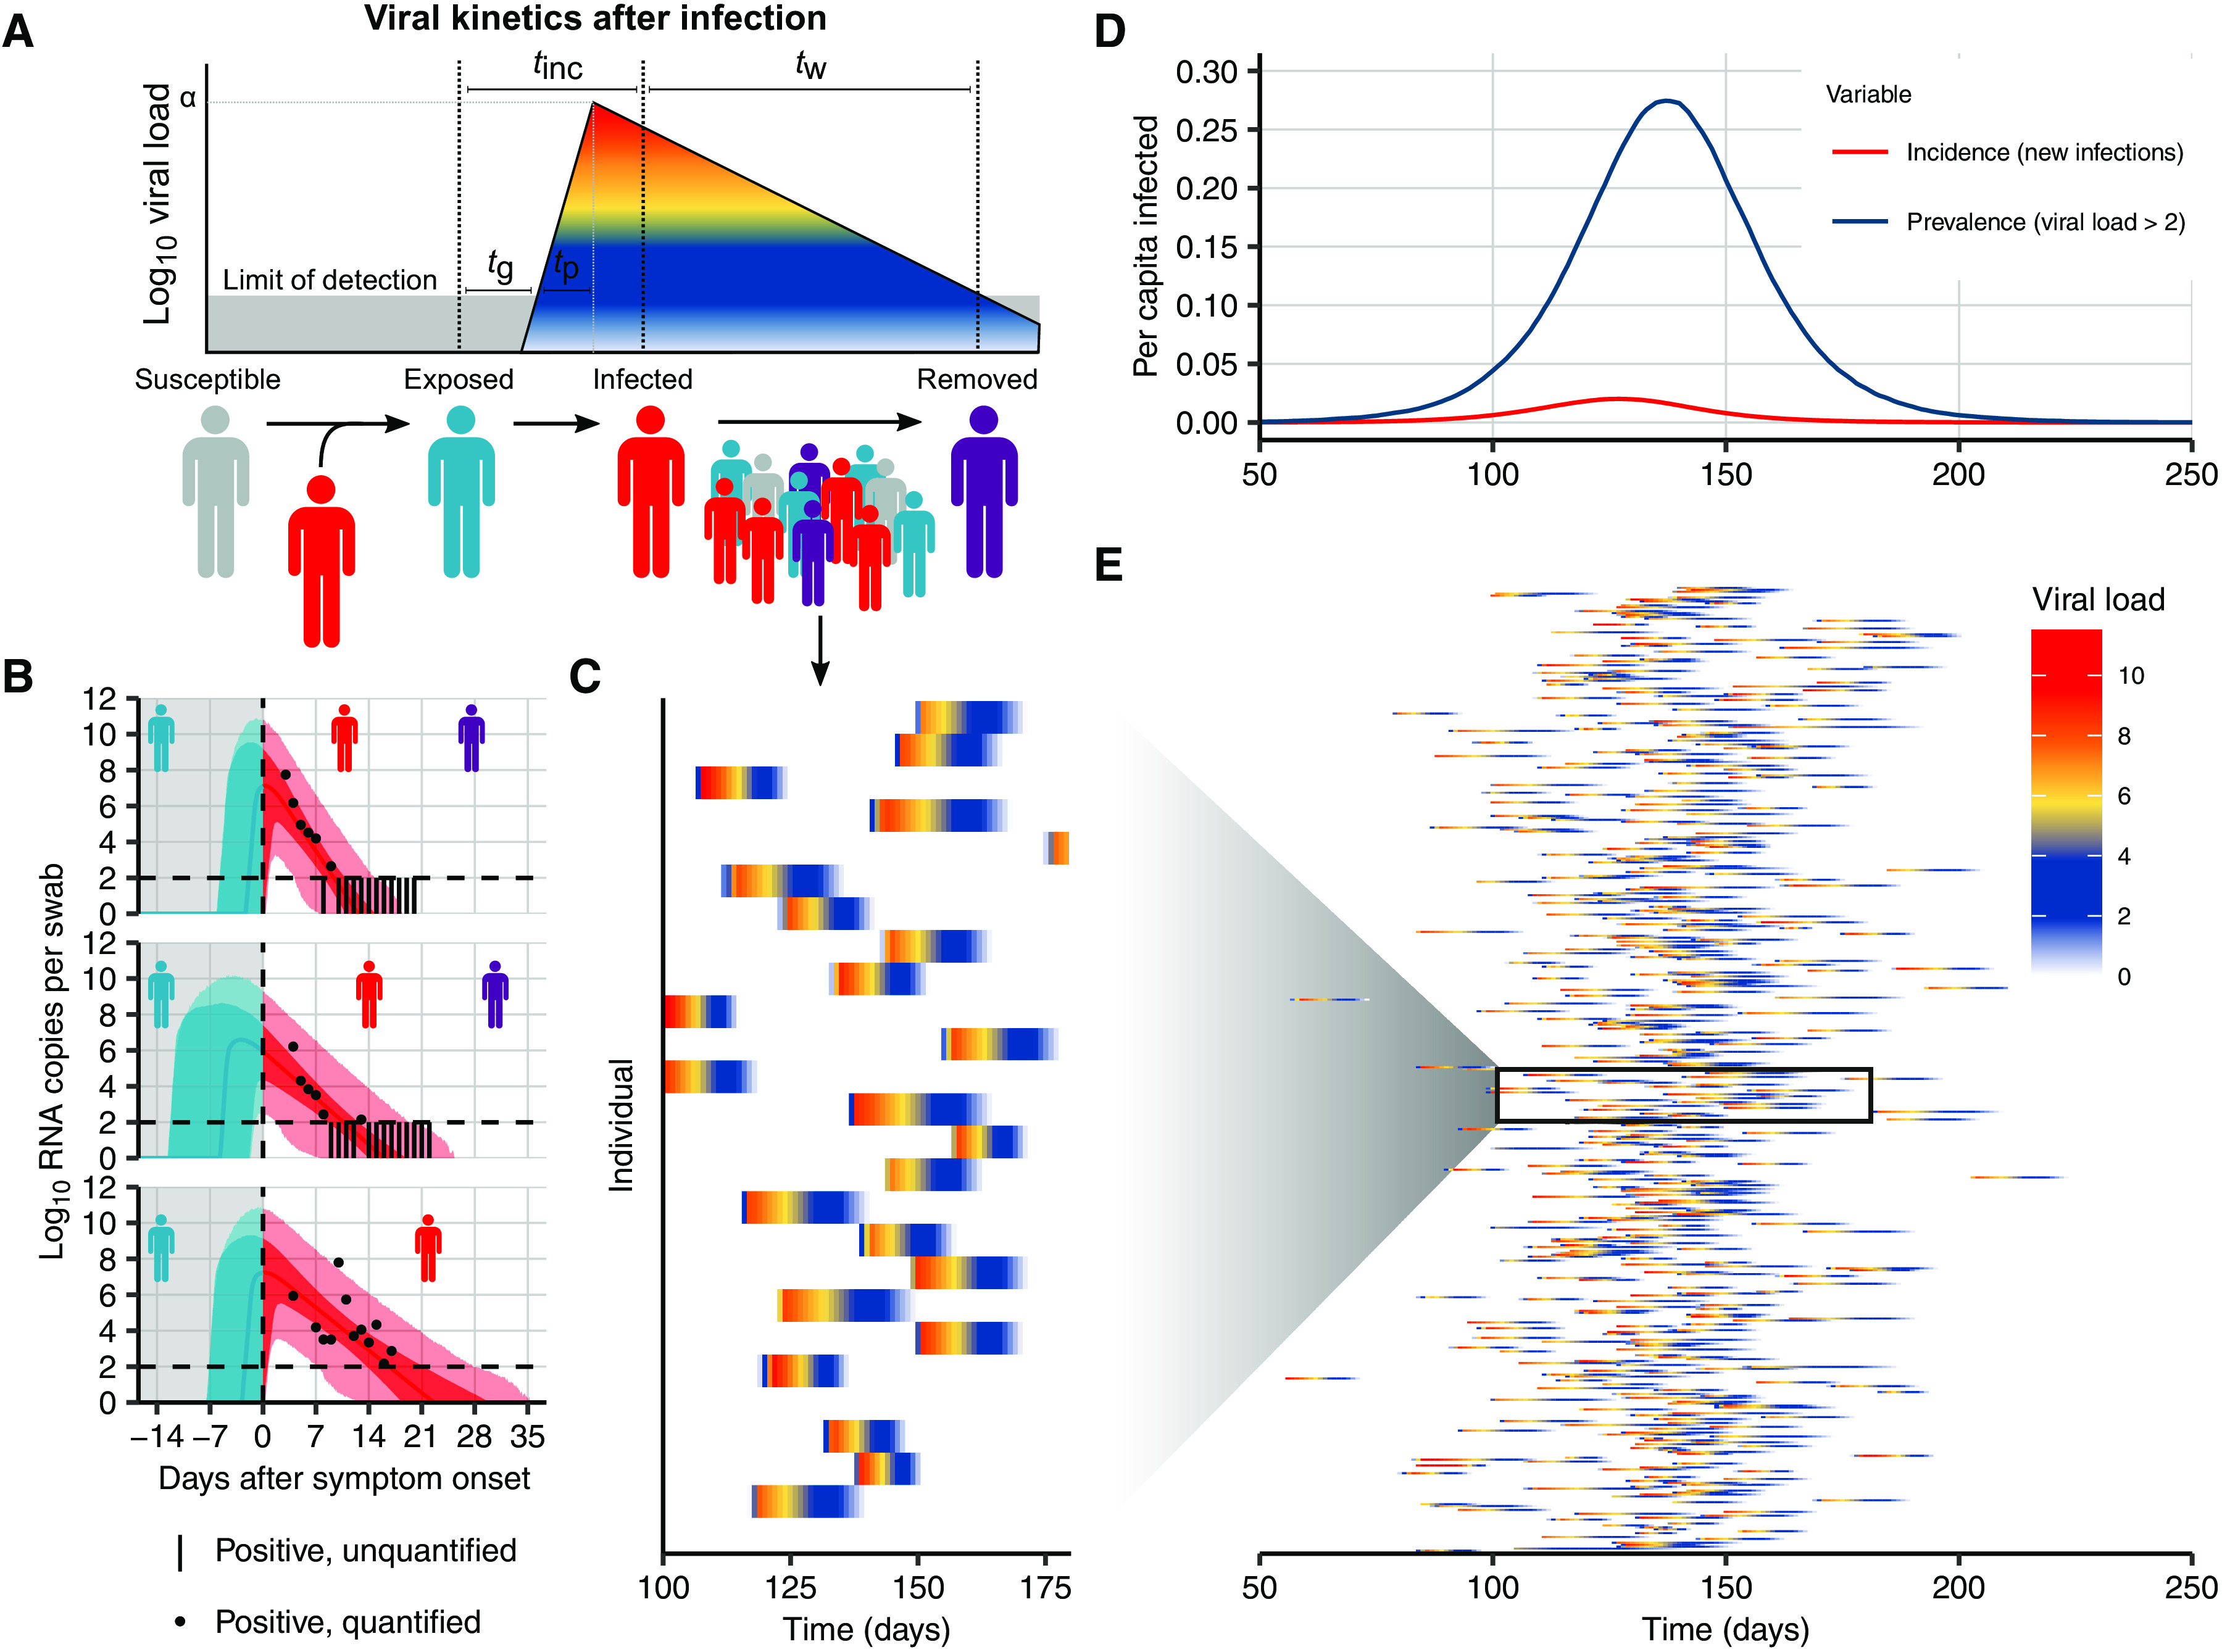
Fig. 2. Viral kinetics model fits, simulated infection dynamics, and population-wide viral load kinetics.

(A) Schematic of the viral kinetics and infection model. Individuals begin susceptible with no viral load (susceptible), acquire the virus from another infectious individual to become exposed but not yet infectious (exposed), experience an increase in viral load to become infectious and possibly develop symptoms (infected), and, last, either recover after viral waning or die (are removed). This process is simulated for many individuals. Symbols shown are tg as the time from infection to viral load crossing the limit of detection, tp as the time from first detectable viral load to peak, tinc as the time from infection to symptom onset, and tw as the time from symptom onset to loss of detectable viral load. (B) Model fits to time-varying viral loads in swab samples. The black dots show observed log10 RNA copies per swab, black bars show positive but unquantified swab samples, solid lines show posterior median estimates, dark shaded regions show 95% credible intervals (CIs) on model-predicted latent viral loads, and light shaded regions show 95% CI on simulated viral loads with added observation noise. The blue region shows viral loads before symptom onset, and the red region shows time after symptom onset. The horizontal dashed line shows the limit of detection. (C and E) Twenty-five and 500 simulated viral loads over time, respectively. The heatmap shows the viral load in each individual over time. The distribution of viral loads reflects the increase and subsequent decline of prevalence. We simulated from inferred distributions for the viral load parameters, thereby propagating substantial individual-level variability through the simulations. Marginal distributions of observed viral loads during the different epidemic phases are shown in fig. S4. (D) Simulated infection incidence and prevalence of virologically positive individuals from the SEIR model. Incidence was defined as the number of new infections per day divided by the population size. Prevalence was defined as the number of individuals with a viral load of >100 (log10 viral load >2) in the population divided by the population size on a given day.
