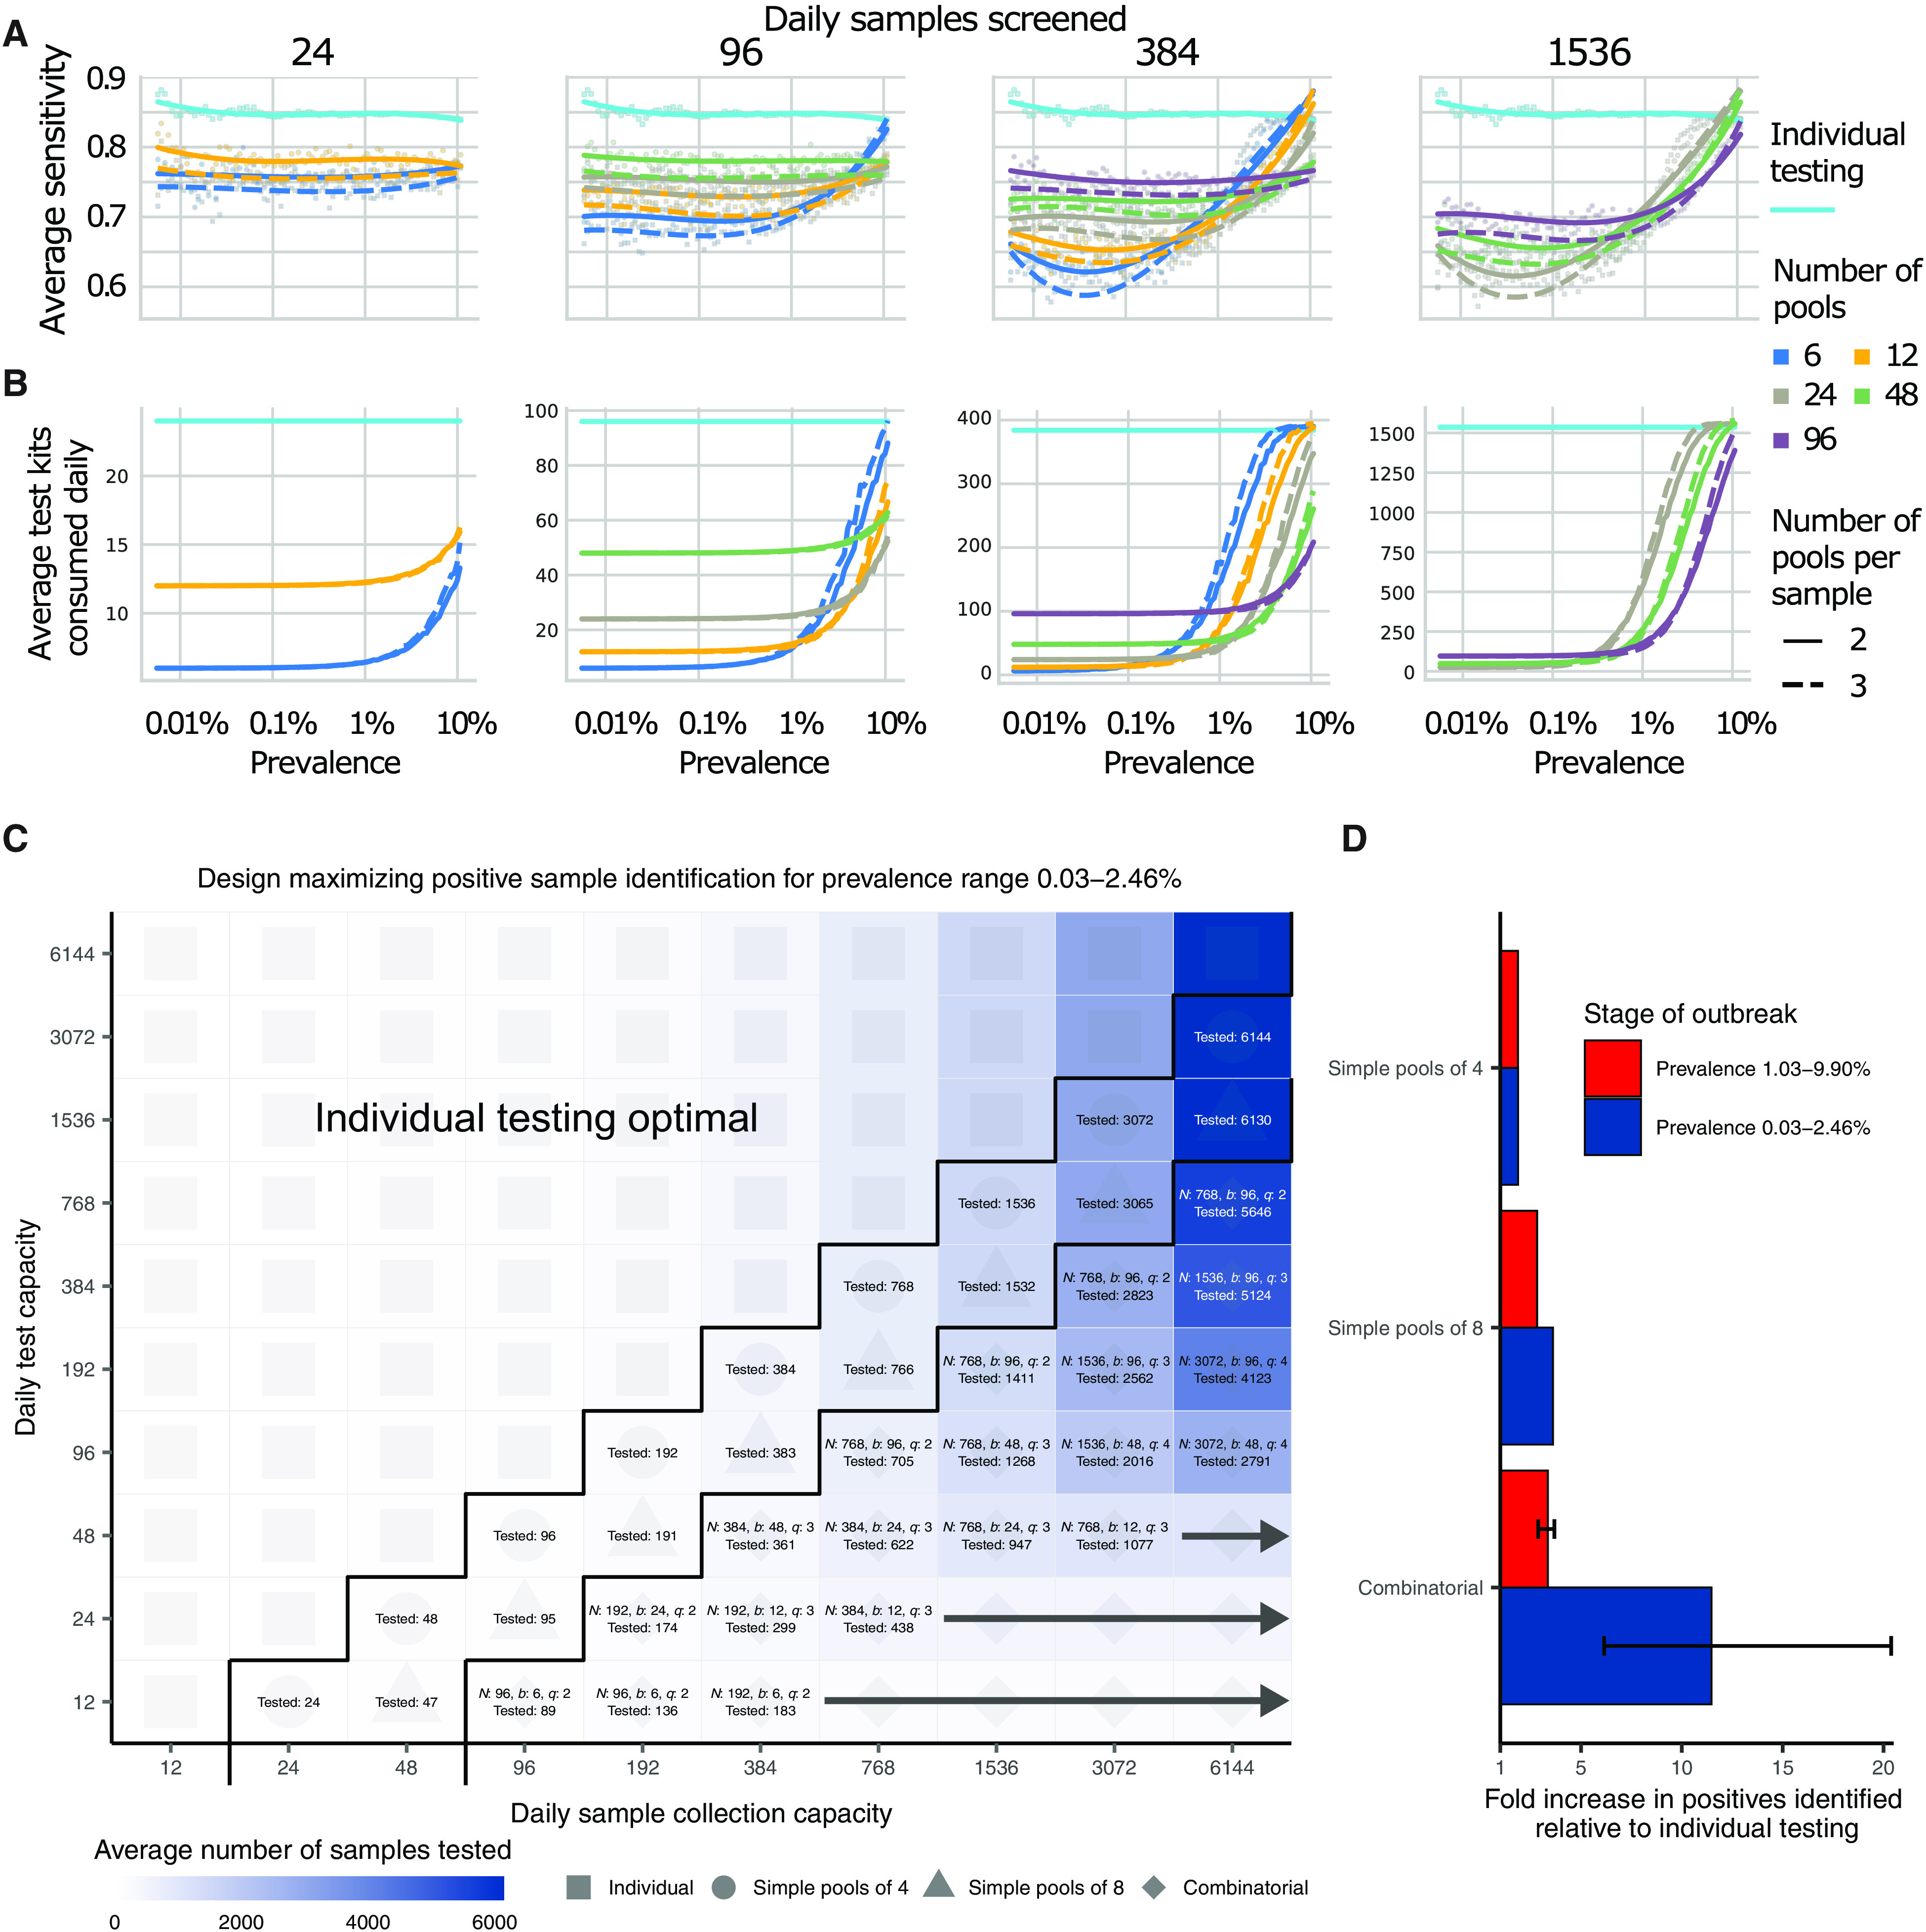
Fig. 4. Group testing for sample identification.

We evaluated a variety of group testing designs for sample identification (table S1) based on sensitivity (A), efficiency (B), total number of positive samples identified (C), and the fold increase in positive samples identified relative to individual testing (D). (A and B) The average sensitivity (A) (y axis, individual points and spline) and average number of tests needed to identify individual positive samples (B) (y axis) using different pooling designs (individual lines) were measured over days 20 to 110 in our simulated population, with results plotted against prevalence (x axis, log scale). Results show the average of 200,000 trials, with individuals selected at random on each day in each trial. Pooling designs are separated by the number of samples tested on a daily basis (individual panels), the number of pools (color), and the number of pools into which each sample is split (dashed versus solid line). Solid teal line indicates results for individual testing. Note that the average number of test kits consumed increases with prevalence due to a greater number of positive pools requiring confirmatory testing. (C) Every design was evaluated under constraints on the maximum number of samples collected (columns) and average number of reactions that can be run on a daily basis (rows) over days 40 to 90. Text in each box indicates the optimal design for a given set of constraints [number of samples per batch (N), number of pools (b), number of pools into which each sample is split (q), and average number of total samples screened per day]. Color indicates the average number of samples screened on a daily basis using the optimal design. Arrows indicate that the same pooling design is optimal at higher sample collection capacities due to testing constraints. (D) Fold increase in the number of positive samples identified relative to individual testing with the same resource constraints. Error bar shows range among optimal designs.
