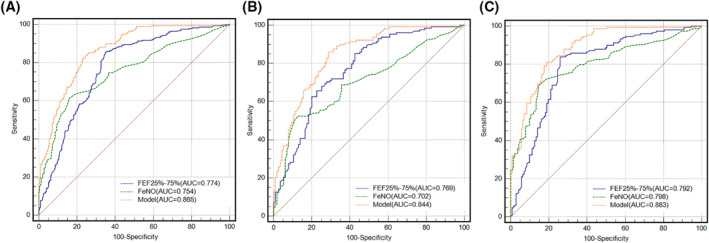
FIGURE 1.

ROC curves for the model of FEF25%–75% combined with FeNO in predicting positive bronchial provocation in patients of the discovery cohort prior to being stratified by age (A), patients aged ≥55 years (B), and patients aged <55 years (C). (A) n = 534, AUCmodel = 0.865 (95% CI, 0.833–0.893); AUCFEF25%–75% = 0.774 (95% CI, 0.736–0.809; p < 0.0001, compared with the model); AUCFeNO = 0.754 (95% CI, 0.716–0.790; p = 0.5176 and <0.0001, compared with FEF25%–75% alone and the model, respectively). (B) n = 243, AUCmodel = 0.844 (95% CI, 0.792–0.887); AUCFEF25%–75% = 0.769 (95% CI, 0.711–0.820; p = 0.0005, compared with the model); AUCFeNO = 0.702 (95% CI, 0.640–0.759; p = 0.1700 and <0.0001, compared with FEF 25%–75% alone and the mode, respectively). (C) n = 291, AUCmodel = 0.883 (95% CI, 0.841–0.918); AUCFEF25%–75% = 0.792 (95% CI, 0.740–0.837; p < 0.0001, compared with the model); AUCFeNO = 0.798 (95% CI, 0.747–0.842; p = 0.8724 and 0.0001, compared with FEF25%–75% alone and the model, respectively)
