FIGURE 5.

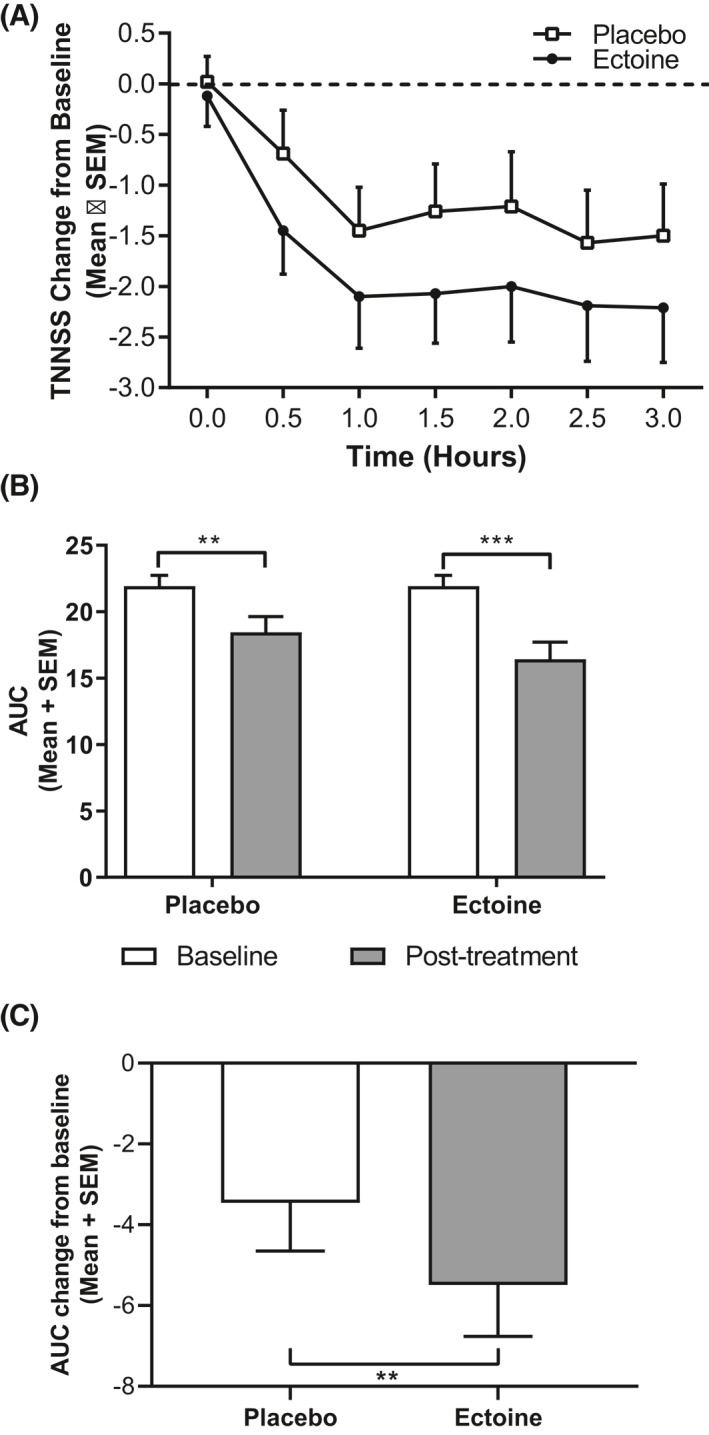
Total non‐nasal symptom score (TNNSS). Data are expressed as mean + SEM. (A) TNNSS change from baseline revealed larger decreases for patients receiving ectoine at every time point in the EEC. Baseline is defined as the symptom scores at Visit 2. (B) Mean TNNSS area under the curve (AUC) scores showed a significant reduction under ectoine and placebo treatment (***p < 0.0001, **p = 0.0059). (C) Patients receiving ectoine experienced statistically significant reductions in TNNSS when compared to placebo, as shown by the percent change from baseline (**p = 0.0108). EEC, environmental exposure chamber; SEM, standard error of the mean
