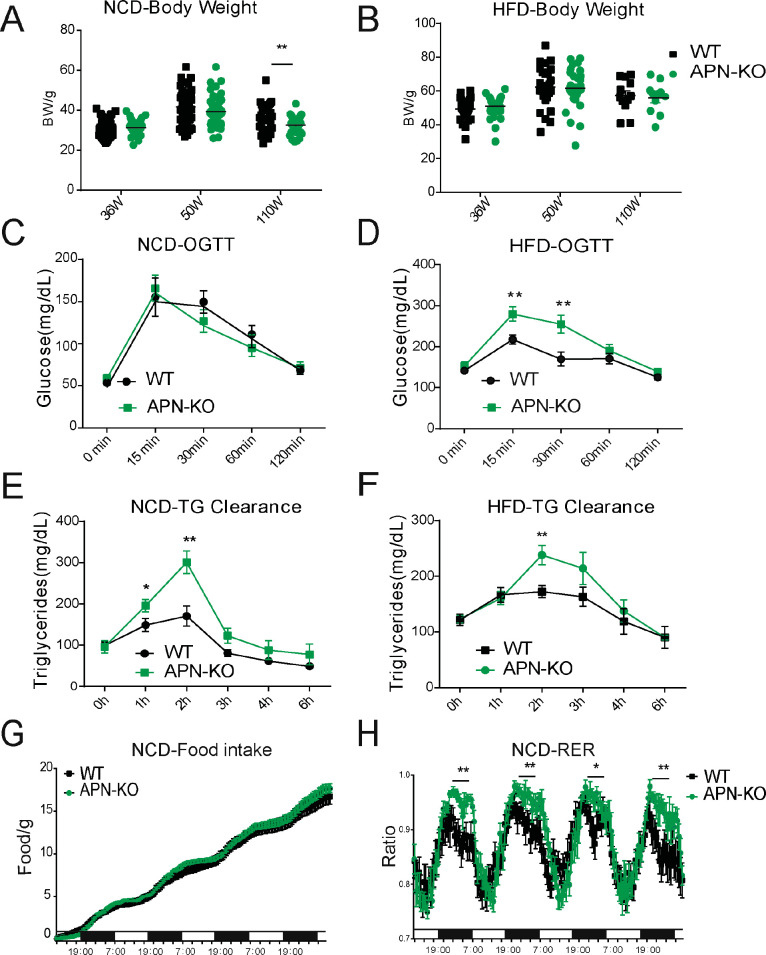
Figure 2. Lack of adiponectin (APN) in aging mice worsens glucose and lipid homeostasis.
(A) Body weights during aging processes for wild-type (WT) and adiponectin null (APN-KO) mice fed on chow diet. (B) Body weights during aging processes for WT and APN-KO mice fed on high-fat diet (HFD). (C) An oral glucose tolerance test (OGTT) (2 g kg−1 body weight; single gavage) on chow diet-feeding WT and APN-KO mice at 110 weeks old (n = 7 per group). (D) An OGTT (1.25 g kg−1 body weight; single gavage) on HFD-feeding WT and APN-KO mice at 85-weeks old (n = 8 for WT, n = 7 for APN-KO mice). (E) Triglyceride (TG) clearance test (20% intralipid; 15 μl g−1 body weight; single gavage) in chow diet-feeding WT and APN-KO mice at 110 weeks old (n = 9 for WT, n = 10 for APN-KO mice). (F) TG clearance test (20% intralipid; 15 μl g−1 body weight; single gavage) in HFD-feeding WT and APN-KO mice at 85 weeks old (n = 8 per group). (G) Metabolic cage analyses showing food intake for chow diet-feeding WT in APN-KO mice at 110 weeks old (n = 8 for WT, n = 7 for APN-KO mice). Data are mean ± SEM. Student’s t test: *p<0.05, **p<0.01, ***p<0.001 for WT vs. APN-KO. (H) Metabolic cage analyses showing respiratory exchange rate (RER) chow diet-feeding WT and APN-KO mice at 110 weeks old (n = 8 for WT, n = 7 for APN-KO mice). Data are mean ± SEM. Student’s t test: *p<0.05, **p<0.01, ***p<0.001 for WT vs. APN-KO.


