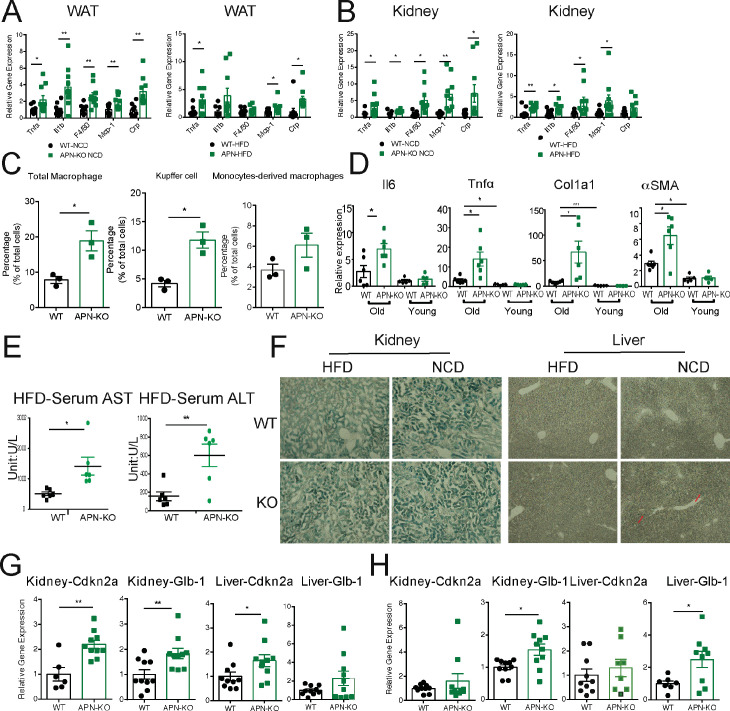
Figure 4. Absence of adiponectin (APN) in aged mice exacerbates inflammation and accelerates aging.
(A) Expression of inflammatory markers in epididymal fat depots of 140-week-old wild-type (WT) and adiponectin null (APN-KO) mice fed on chow diet and 100-week-old WT and APN-KO fed on HFD(n = 10 per group). (B) Expression of inflammatory markers in kidneys of 140-week-old WT and APN-KO mice fed on chow diet and 100-week-old WT and APN-KO HFD (n = 8–10 per group). (C) FACS analysis of percentages of total macrophages, Kupffer cells, and monocytes-derived macrophages isolated from 100-week-old WT and APN-KO mice fed on HFD (n = 3 per group). (D) Expression of inflammatory and fibrosis markers in liver tissues of 20-week-old and 100-week-old WT and APN-KO mice fed on HFD (n = 5 per group of young cohorts, n = 6 per group of aged cohorts). (E) Serum AST and ALT activities in 100-week-old WT and APN-KO mice fed on HFD (n = 6 per group). (F) β-Galactosidase staining of kidney and liver sections from 100-week-old WT and APN-KO mice fed on HFD or 140-week-old WT and APN-KO mice on chow diet examines cellular senescence. (G) Expression of senescence biomarkers in kidneys and livers of 140-week-old WT (n = 6 or 10) and APN-KO mice fed on chow diet (n = 10). (H) Expression of senescence biomarkers in kidneys and livers of 100-week-old WT (n = 7–10) and APN-KO mice fed on HFD (n = 8–10). Bar, 100 μm. Data are mean ± SEM. Student’s t test: *p<0.05, **p<0.01, ***p<0.001 for WT vs. APN-KO.


