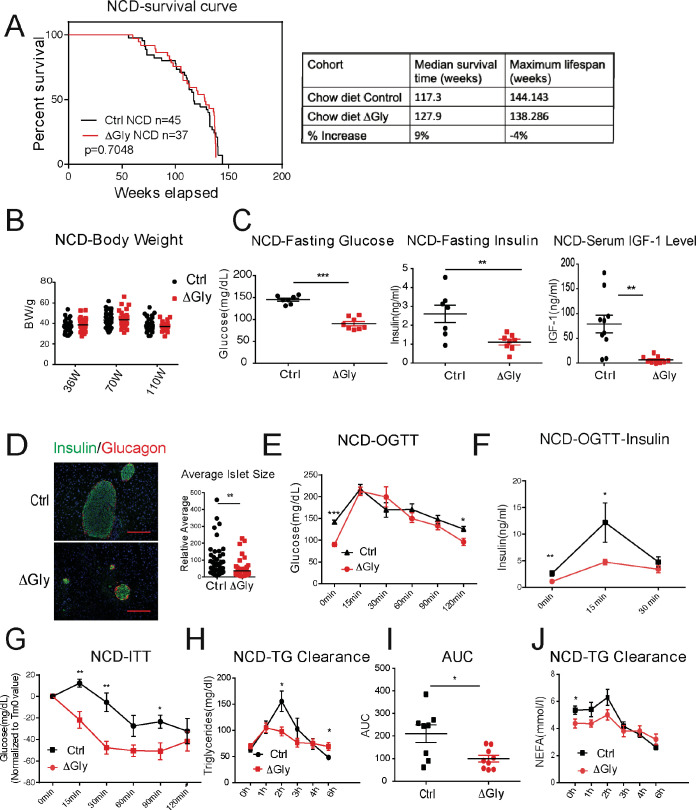
Figure 5. Increasing adiponectin protects against aging-induced metabolic disturbance.
(A) Kaplan–Meier survival curves for controls and ΔGly mice on chow diet. Median survival time and maximum lifespan for each cohort. n denotes the number of mice per group. p-Values were determined by log-rank (Mantel–Cox) test. (B) Body weights during aging processes for controls and ΔGly mice fed on chow diet. (C) Systemic glucose, insulin, and insulin-like growth factor 1 (IGF-1) levels in 50-week-old controls and ΔGly mice after fasting 16 hr. (D) Insulin and glucagon IF staining of pancreases from controls and ΔGly mice at 140 weeks old (left). Right: Relative average islet size. (E) An oral glucose tolerance test (OGTT) (2 g kg−1 body weight; single gavage) revealed marginally improved glucose tolerance in 50-week ΔGly compared with controls (n = 8 per group). (F) Serum insulin levels during glucose tolerance test performed in panel E (n = 7 for controls, n = 8 for ΔGly mice). (G) Insulin tolerance test (ITT) in controls and ΔGly mice at 50 weeks old (n = 8 per group). (H) Triglyceride (TG) clearance test in controls and ΔGly mice at 50 weeks old (n = 8 for controls, n = 9 for ΔGly mice). (I) Area under curve (AUC) calculated based on H. (J) Circulating free fatty acid (FFA) levels in controls and ΔGly mice at 50 weeks old during TG clearance performed in panel H (n = 8 for controls, n = 9 for ΔGly mice). Bar, 100 μm. Data are mean ± SEM. Student’s t test: *p<0.05, **p<0.01, ***p<0.001 for controls vs. ΔGly.

