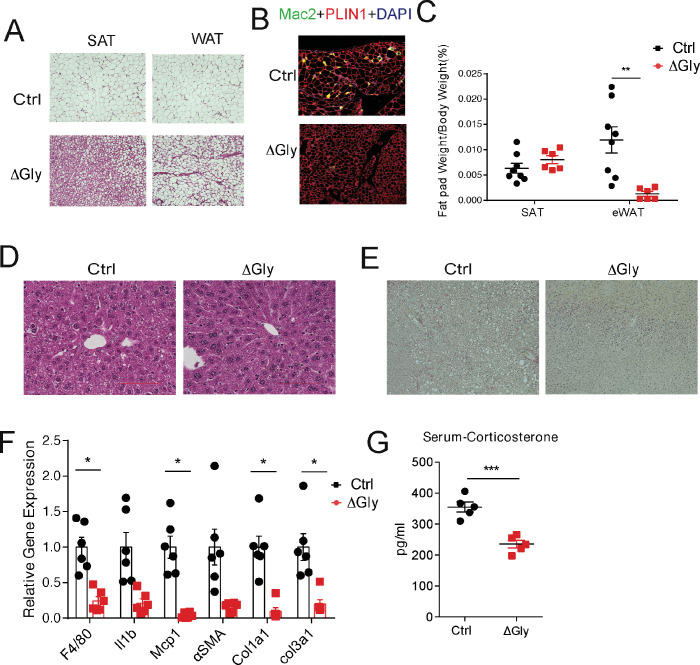
Figure 6. Old adiponectin overexpressing mice exhibit improved glucose and lipid homeostasis.
(A) H&E staining of SubQ fat depot and Epi fat depot of 140-week-old controls and ΔGly mice fed on chow diet. (B) Mac2 staining of epididymal fat sections in 140-week-old controls and ΔGly mice. (C) Relative subcutaneous and visceral fat pad weights of 140-week-old controls and ΔGly mice fed on chow diet (n = 8 for controls, n = 6 for ΔGly mice). (D) H&E staining of liver from 140-week-old controls and ΔGly mice fed on chow diet. (E) Picrosirius red staining of livers from 140-week-old controls and ΔGly mice fed on chow diet. (F) Expression of inflammatory and fibrosis markers in liver of 140-week-old controls and ΔGly mice fed on chow diet (n = 8 for controls, n = 6 for ΔGly mice). (G) Serum corticosterone level in 140-week-old controls and ΔGly mice fed on chow diet (n = 5 per group). Bar, 100 μm. Data are mean ± SEM. Student’s t test: *p<0.05, **p<0.01, ***p<0.001 for controls vs. ΔGly.

