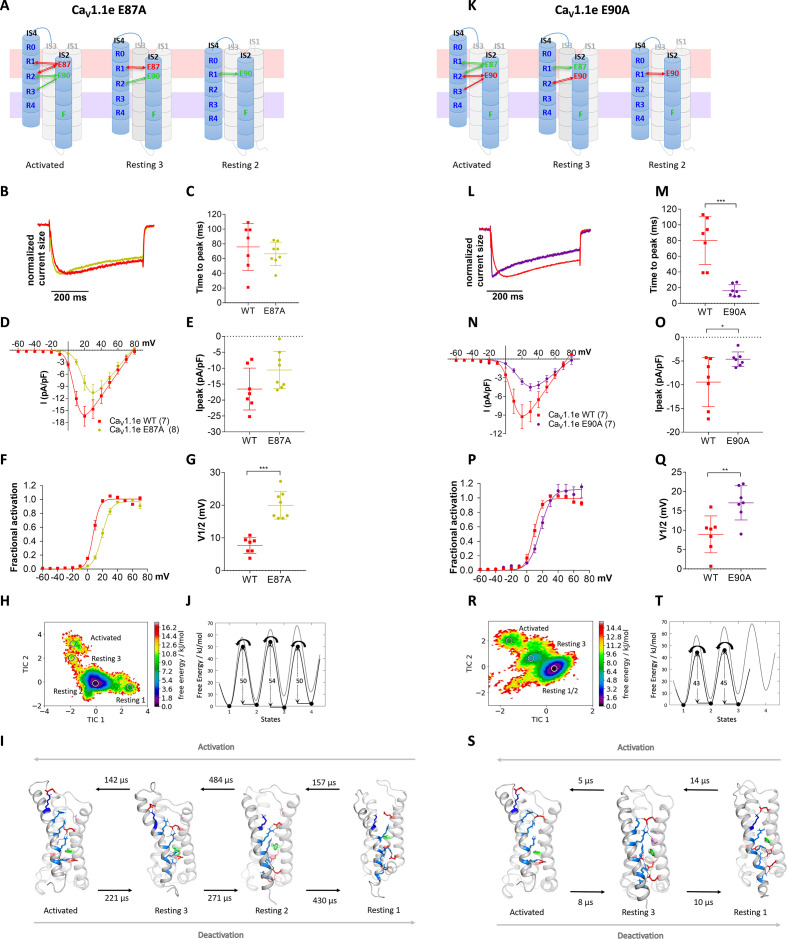
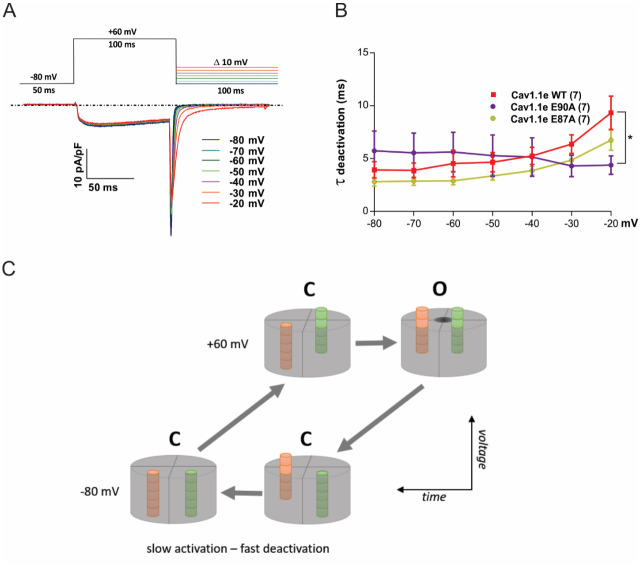
Figure 5. Countercharges E87 and E90 differentially regulate kinetics of voltage sensing domain (VSD) I transitions and current activation.
(A,K) Schematic of VSD I in activated and resting states, showing the loss of ionic interactions upon mutation of E87A or E90A. (B–G) In CaV1.1e E87A right-shifted voltage dependence of activation without affecting kinetics (wildtype [red], E87A [lime]). (L–Q) The E90A mutation accelerated kinetics >4-fold and right-shifted voltage dependence of activation (wildtype [red], E87A [purple]). (B,L) Normalized representative currents show acceleration of activation in E90A (L) but not in E87A (B). (C,M) Time to peak (p=0.47 in C, p=0.00017 in M); (D,N) current-voltage relationship; (E,O) maximum current density (p=0.08 in E, p=0.04 in O); (F,P) voltage dependence of activation; (G,Q) voltage at half-maximal activation (V½) (p=0.000014 in G, p=0.008 in Q). Mean ± SEM; p-values calculated with Student’s t-test. (H–J) The time-lagged independent component analysis (tICA) free energy surface and schematic 1D representation of E87A show four macrostates corresponding to resting states 1, 2, 3 and the activated state with energy barriers similar to wildtype (gray) and transition kinetics in the higher μs timescale. (R–T) E90A shows three macrostates corresponding to the resting states 1 and 3 and the activated state, reduced energy barriers, and transition kinetics in the low μs timescale.


