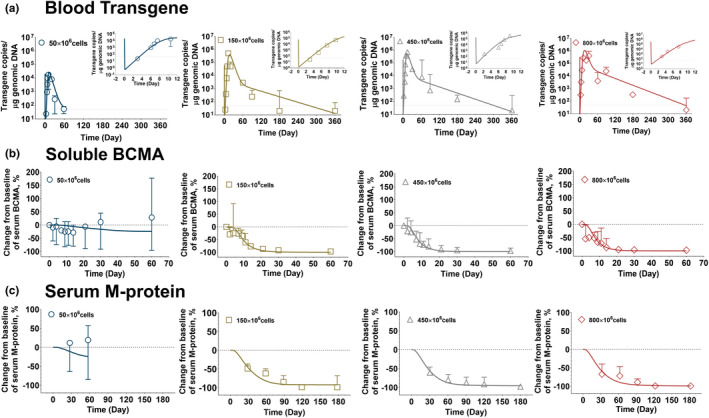
FIGURE 3.

Observed and model fitted profiles for clinical pharmacokinetic (PK)‐pharmacodynamic (PD) profiles for anti‐B‐cell maturation antigen (BCMA) chimeric antigen receptor (CAR) T cell therapy (bb2121). (a) Blood transgene level: Observed mean data (symbols), standard deviation (error bars), and model‐generated (solid lines) profiles of CAR transgene copies/g genomic DNA over time. (b) soluble BCMA: Observed mean data (symbols), standard deviation (error bars), and model‐generated (solid lines) profiles of percentage of change from baseline of soluble BCMA concentration over time. (c) Serum M‐protein: Observed mean data (symbols), standard deviation (error bars), and model‐generated (solid lines) profiles of percentage of change from baseline of M‐protein concentration over time following 50 × 106, 150 × 106, 450 × 106, and 800 × 106 doses of CAR‐T infusion in patients with relapsed/refractory multiple myeloma.
