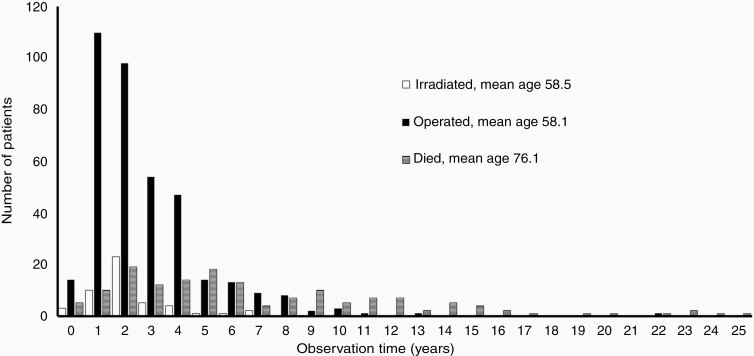
Fig. 2.
Active treatment for patients initially allocated to observation (n = 434) and patients who died during the observation period (n = 147). The black columns represent the number of patients receiving surgery, the white columns represent radiotherapy-treated patients and the horizontally lined columns represent the patients who died.

