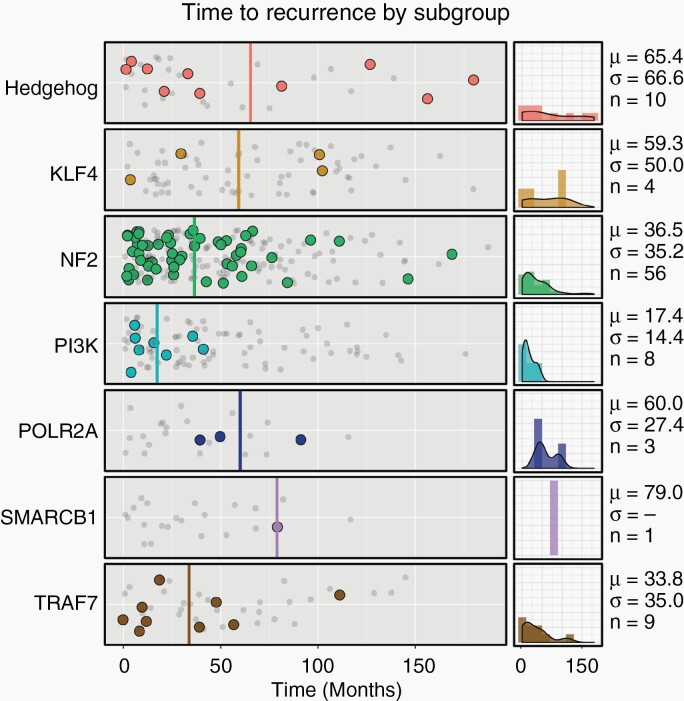
Fig. 3.
Timing of meningioma recurrence. Shown is the time to recurrence (solid dots) or last recurrence-free scan (gray, decreased opacity) for each subgroup in months. The average time to recurrence of PI3K meningiomas was significantly less than other tumors (P = 7.5 × 10⁻³). Averages for each subgroup are shown in solid lines. Density plots of each subgroup’s recurrences are shown on the right, along with the mean (μ), standard deviation (σ), and number of recurrences (n).

