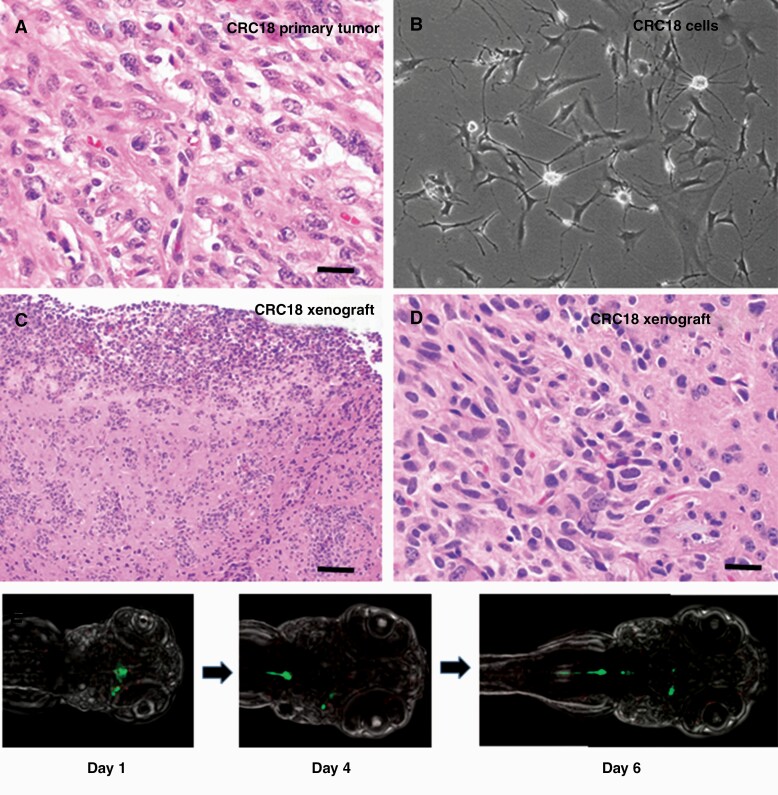
Fig. 2.
Xenografts of JHH-CRC cultures. (A) Representative H&E-stained image of JHH-CRC18 primary tumor (×400, scale bar 25 microns). (B) Phase contrast image of JHH-PXA1 (CRC18) culture. (C, D) Representative H&E-stained images of JHH-PXA1 mouse xenografts (×100, ×400, scale bars 100 microns, 25 microns). (E) Confocal images showing migration of JHH-NF1-PA1 cells (green) in zebrafish xenografts, taken at ×15 on days 1, 4, and 6 postinjection. CRC, conditionally reprogrammed cells; PA, pilocytic astrocytoma.

