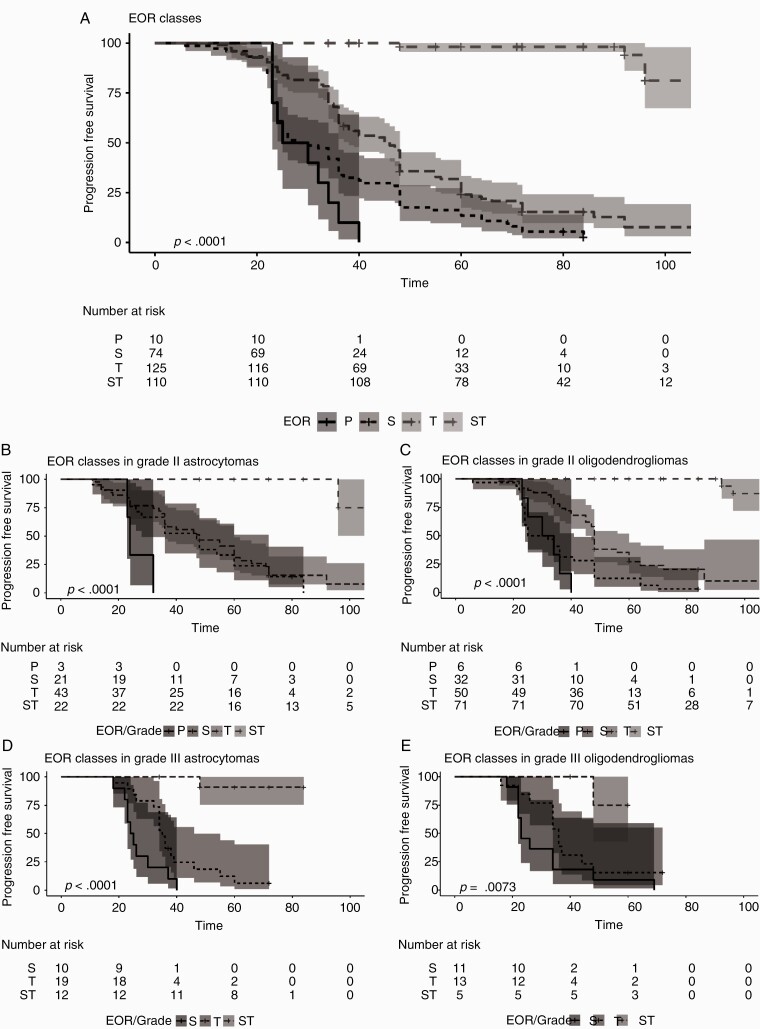
Fig. 2.
Kaplan Meier curves for PFS for EOR classes, and in molecular and tumor grade defined subtypes. (A) Kaplan‒Meier curves and number at risk for PFS and EOR classes. The analysis includes all 319 IDH-mutated LGGs. Time is expressed as months. Patients were categorized according to EOR classes. In Partial (N = 10) (black line) median PFS was 27.5 (95% CI: 23 NA) months (univariable HR, 1[reference]); in Subtotal (N = 74) (black small dotted line) was 29(95% CI: 29–25) months (univariable HR, 0.51 [95% CI: 0.26–1]; P = 0.05), in Total (N = 125) (black medium dotted line) was 46 (95% CI: 38–48) months (univariable HR, 0.27 [95% CI: 0.14–0.54]; P < 0.001); in supratotal (N = 110) (black large dotted lined) at 92 months 94% of patients had no recurrences (univariable HR, 0.01 [95% CI: 0.00–0.02]; P < 0.001). Shadings are the 95% confidence intervals. (B) Kaplan‒Meier curves and number at risk for PFS and EOR classes in IDH-mutated grade II astrocytomas. Only grade II IDH mutated astrocytomas were included (N = 89). Time is expressed as months. Patients were categorized according to EOR classes. In Partial (N = 3) (black line) median PFS was 24 (95% CI: 23 NA) months (univariable HR, 1[reference]); in Subtotal (N = 21) (black small dotted line) was 47 (95% CI: 28–72) months (univariable HR, 0.26 [95% CI: 0.07–0.94]; P = 0.04), in Total (N = 43) (black medium dotted line) was 48 (95% CI: 36–60) months (univariable HR, 0.21 [95% CI: 0.06–0.73]; P = 0.01); in supratotal (N = 22) (black large dotted lined) at 80 months 100% of patients had no recurrences months (univariable HR, 0.01 [95% CI: 0.00–0.06]; P < 0.001). Shadings are the 95% confidence intervals. (C) Kaplan‒Meier curves and number at risk for PFS and EOR classes in IDH-mutated grade II oligodendrogliomas. Only grade II IDH-mutated oligodendrogliomas were included (N = 159). Time is expressed as months. Patients were categorized according to EOR classes. In Partial (N = 6) (black line) median PFS was 32 (95% CI: 25 NA) months (univariable HR, 1[reference]); in Subtotal (N = 32) (black small dotted line) was 28.5 (95% CI: 24–41) months (univariable HR, 0.60 [95% CI: 0.25–1.48]; P = 0.27), in Total (N = 50) (black medium dotted line) was 48 (95% CI: 45–60) months (univariable HR, 0.24 [95% CI: 0.10–0.60];P = 0.002); in supratotal (N = 71) (black large dotted lined) at 80 months 100% of patients had no recurrence, at 92 months 93.8% had no recurrence months (univariable HR, 0.004 [95% CI: 0.00–0.02]; P < 0.001). Shadings are the 95% confidence intervals. (D) Kaplan‒Meier curves and number at risk for PFS and EOR classes in IDH mutated grade III astrocytomas. Only grade III IDH mutated astrocytomas were included (N = 41). Time is expressed as months. Patients were categorized according to EOR classes. In Subtotal (N = 10) (black line) was 24.5 (95% CI: 23 NA) months (univariable HR, 1 [reference]), in Total (N = 19) (black small dotted line) was 35(95% CI: 34–46) months (univariable HR, 0.35 [95% CI: 0.15–0.81]; P = 0.01); in supratotal (N = 12) (black large dotted lined) at 48 months 90% of patients had no recurrence (univariable HR, 0.01 [95% CI: 0.00–0.11]; P < 0.001). Shadings are the 95% confidence intervals. (E) Kaplan Meier curves and number at risk for PFS and EOR classes in IDH mutated grade III oligodendrogliomas. Only grade III IDH mutated oligodendrogliomas were included (N = 30). Time is expressed as months. Patients were categorized according to EOR classes. In Partial (1 case, not shown in figure and in the analysis) PFS was 23 months, in Subtotal (N = 11) (black dotted line) median PFS was 23 (95% CI: 22 NA) months (univariable HR, 1[reference]), in Total (N = 13) (black small dotted line) was 36 (95% CI: 34 NA) months (univariable HR, 0.53 [95% CI: 0.23–1.25]; P = 0.15); in supratotal (N = 5) (black large dotted lined) at 48 months 75% of patients had no recurrence (univariable HR, 0.07[95% CI: 0.01–0.58]; P = 0.01). Shadings are the 95% confidence intervals.

