Fig. 1.
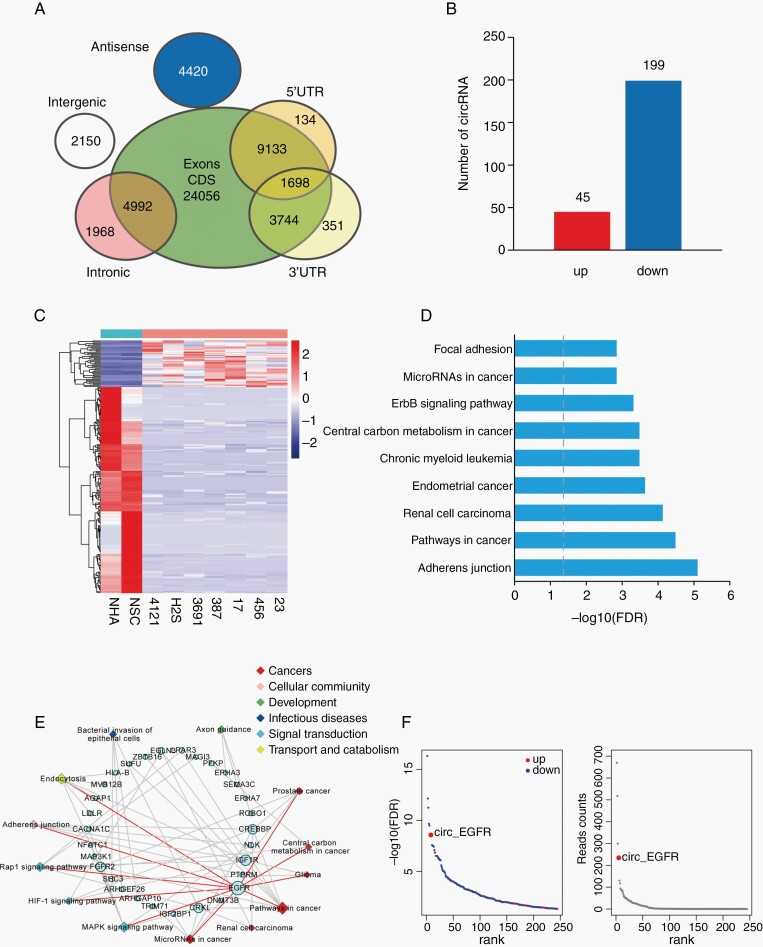
Profiling of circular RNAs in brain tumor-initiating cells (BTICs), neuro stem cells (NSCs), and NHAs. (A). Venn plot showing the number of all circRNAs derived from different genomic regions. (B). The numbers of differentially expressed circRNAs (DEcRs) with false discovery rate (FDR) < .05 and fold change > 2 between cancerous and normal cells. (C). Heat map of all DEcRs. (D). The top 9 enrichment scores by Kyoto Encyclopedia of Genes and Genomes (KEGG) pathway analysis among DEcRs derived host genes. X axis: enriched pathways, Y axis: −log10 FDR. (E). The network of 13 enriched pathways and host genes of DEcRs. Circular nodes represent host genes; rhombic nodes represent pathways. The size denotes the number of genes or pathways related to the nodes. (F). Left, −log10 FDR of DEcRs. The blue and red points represented downregulated and upregulated circRNAs. X axis: DEcRs, Y axis: −log10 FDR. Right, Reads count of DEcRs. X axis: DEcRs, Y axis: read counts.

