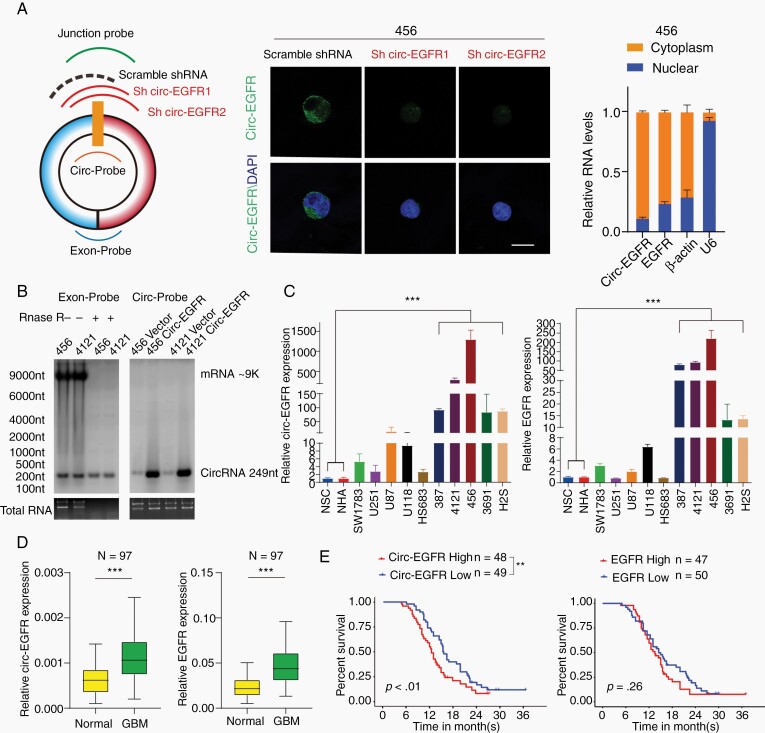
Fig. 2.
Characterization of circ-EGFR in glioblastoma (GBM). (A). Left, circ-EGFR junction probe, 2 junction shRNAs and a scramble shRNA. Middle, fluorescence in situ hybridization (FISH) with junction probes was used to decide the subcellular localization of circ-EGFR in 456 brain tumor-initiating cells (BTICs). circ-EGFR shRNA1 and circ-EGFR shRNA2 were used to show the specificity. Scale bars, 20 μM. Right, cytoplasmic and nuclear fractions were isolated to determine circ-EGFR and linear EGFR. β-actin and U6 were used as cytoplasmic or nuclear markers. (B). Left, detection of linear EGFR mRNA and circ-EGFR with exon probe plus RNAse R treatment. Right, detection of circ-EGFR with junction probe. (C). Relative circ-EGFR (left) and linear EGFR (right) mRNA levels in indicated cell lines. (D). Relative circ-EGFR and linear EGFR mRNA levels of GBM and paired adjacent normal tissues in a cohort of 97 GBM patients. (E). Left, 97 patients in the cohort were divided into 2 groups according to relative circ-EGFR expression. The overall survival time of each group was calculated, Right, GBM patient overall survival based on linear EGFR mRNA expression in above cohort. Lines show the mean ± SD. *P < .05, **P < .01, ***P < .001. Data are representative of 2–3 experiments with similar results.

