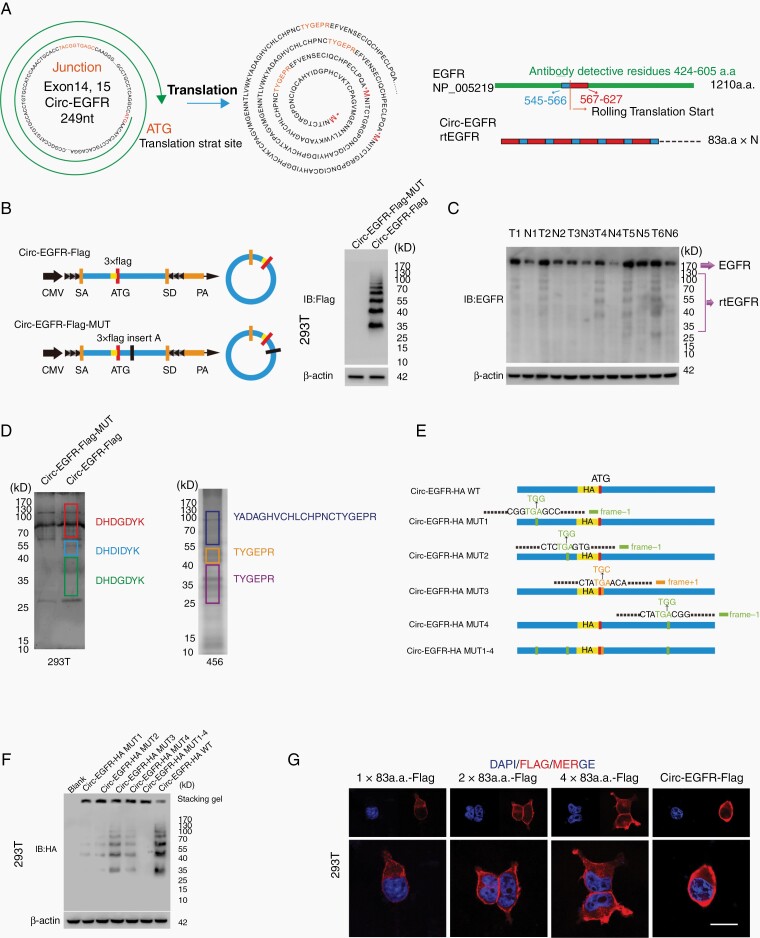
Fig. 3.
Circ-EGFR encoded rolling-translated EGFR (rtEGFR). (A). Upper, the putative iORF in circ-EGFR and the sequences. Lower, illustration of EGFR sequence and rtEGFR sequence. The antibody used in the study recognized 424–605 a.a. of EFGR. (B). Left, illustration of Circ-EGFR-Flag and Circ-EGFR-Flag-MUT. Right, rtEGFR expression was confirmed by immunoblotting (IB) using Flag antibody in Circ-EGFR-Flag and Circ-EGFR-Flag-MUT transfected 293T. (C). Endogenous rtEFGR expression was detected in paired glioblastoma (GBM) samples by using EGFR antibody. (D). Left, the differential gel bands 30–40 kD, 40–55 kD, and 70–170 kD from Circ-EGFR-Flag and Circ-EGFR-Flag-MUT transfected 293T cells were cut and subjected to LC–MS/MS separately. The identified 3xFlag sequences are shown. Right, the differential gel bands 30–40 kD, 40–55 kD, and 70–170 kD from 456 cells were cut and subjected to LC–MS/MS separately. rtEGFR junction-specific peptides are shown. (E). Illustration of circ-EGFR-HA-WT, circ-EGFR-HA-MUT1, circ-EGFR-HA-MUT2, circ-EGFR-HA-MUT3, circ-EGFR-HA-MUT4, and circ-EGFR-HA-MUT1-4 plasmids. Out of frame stop codons (OSC) are shown (green for −1 frame, orange for +1 frame). (F). Total protein from circ-EGFR-HA-WT, circ-EGFR-HA-MUT1, circ-EGFR-HA-MUT2, circ-EGFR-HA-MUT3, circ-EGFR-HA-MUT4 and circ-EGFR-HA-MUT1-4, circ-EGFR-HA-WT transfected 293T cells was evaluated by immunoblotting using HA antibody. Stacking gel was preserved and transferred to detected extra-large proteins. (G). 293T cells were transfected with 1×83a.a.-Flag, 2×83a.a.-Flag, 4×83a.a.-Flag or Circ-EGFR-Flag. Immunofluorescence using anti-Flag was performed. Scale bars, 20 μM. Lines show the mean ± SD. ***P < .001. Data are representative of 2–3 experiments with similar results.

