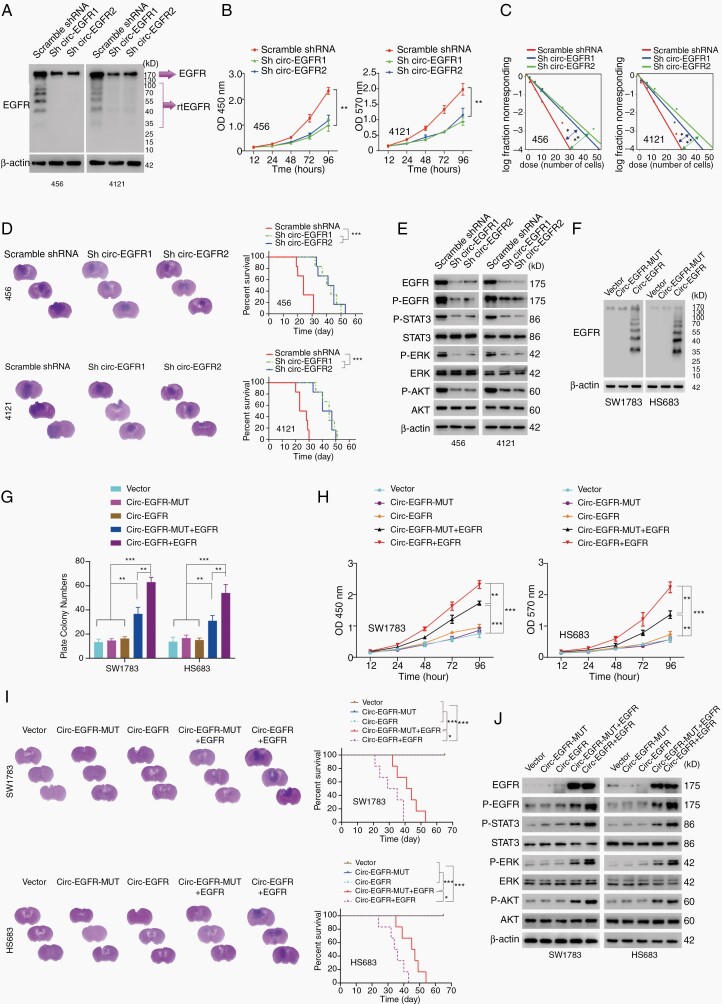
Fig. 4.
Biological functions of circ-EGFR in glioma cell lines. (A). 456 and 4121 brain tumor-initiating cells (BTICs) were transfected with circ-EGFR shRNA1, 2 or scramble shRNA. (B). Cell proliferation of indicated cells was determined by CCK8. (C) In vitro extreme limiting dilution assays (LDAs) in indicated cells. (D) 456 and 4121 BTICs with indicated modification were intracranially injected into nude mice (1 × 10⁵ cells, per mice, 6 mice per group). Representative HE staining of brain sections in each experimental group is shown. Survival analysis was calculated by Kaplan–Meier curve. (E). The expression of the downstream signaling pathway of EGFR was determined by IB in 456 and 4121 BTICs with indicated modifications. (F). SW1783 and Hs683 glioma cells were transfected with circ-EGFR-MUT, circ-EGFR, or empty vector. The rolling-translated EGFR (rtEGFR) expression was confirmed by immunoblotting. (G). Plate colony formation of vector, circ-EGFR-MUT, circ-EGFR, circ-EGFR-MUT+EGFR, and circ-EGFR+EGFR transfected SW1783 and Hs683. (H). Cell proliferation of vector, circ-EGFR-MUT, circ-EGFR, circ-EGFR-MUT+EGFR, and circ-EGFR+EGFR transfected SW1783 and Hs683. (I). SW1783 and Hs683 cells with vector, circ-EGFR-MUT, circ-EGFR, circ-EGFR-MUT+EGFR, and circ-EGFR+EGFR overexpression were intracranially injected into nude mice (1 × 10⁵ per mice, 6 mice per group). Representative HE staining of brain sections in each experimental group is shown. Survival analysis was calculated by Kaplan–Meier curve. (J) The expression of EGFR downstream signaling was determined by Western blotting in vector, circ-EGFR-MUT, circ-EGFR, circ-EGFR-MUT+EGFR, and circ-EGFR+EGFR transfected SW1783 and Hs683. Lines show the mean ± SD. *P < .05, **P < .01, ***P < .001. Data are representative of 2–3 experiments with similar results.

