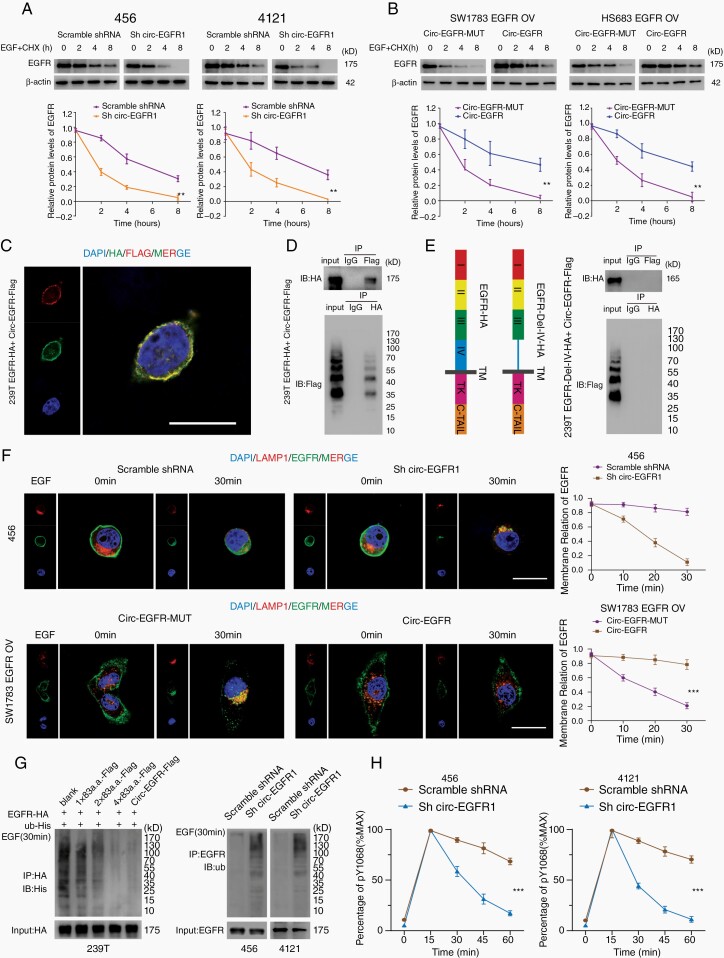
Fig. 5.
Rolling-translated EGFR (rtEGFR) sustained EGFR membrane localization and prevented EGFR degradation. (A). Upper panel, 456 and 4121 brain tumor-initiating cells (BTICs) with indicated modifications were treated with EGF and cycloheximide. Total lysates at the indicated time points were collected, and indicated proteins were evaluated by immunoblotting. Lower panel, semi-quantification of EGFR protein levels in above immunoblotting. (B). Upper panel, SW1783 and Hs683 glioma cells with indicated modifications were treated with EGF and cycloheximide. Total lysates at the indicated time points were collected, and indicated proteins were determined by immunoblotting. Lower panel, semi-quantification of EGFR protein levels in above immunoblotting. (C). EGFR-HA and circ-EGFR-Flag vector were transfected into 239T cells, and immunofluorescence was performed using anti-Flag and anti-HA antibodies. Scale bar, 20 μm. (D). Mutual interaction of EGFA-HA and circ-EGFR-Flag was determined by IP in 293T cells. (E). Left, illustration of EGFR-HA and EGFR-Del-IV-HA plasmids. Right panel, in vivo interaction of EGFR-HA and circEGFR-Flag was detected by IP in 293T cells. (F). Immunofluorescence using anti-EGFR (green) and anti-lamp1 (red) was performed to show EGFR cellular localization after EGF stimulation in 456 BTICs or SW1783 with indicated modifications. Scale bars, 20 μM. (G) Left, HA-tagged-EGFR and His-tagged-Ub were cotransfected with 1×83a.a.-flag, 2×83a.a.-flag, 4×83a.a.-flag or circ-EGFR-Flag in 293T cells. IP was performed, followed by IB using the indicated antibodies. Right, Ub levels were detected in 456 and 4121 BTICs with circ-EGFR knockdown and their control cells, followed by IP using the indicated antibodies. (H). Quantitation of EGFR phosphorylation time courses, normalized by signal at 15 min. Lines show the mean ± SD. *P < .05, **P < .01, ***P < .001. Data are representative of 2–3 experiments with similar results.

