Fig. 3.
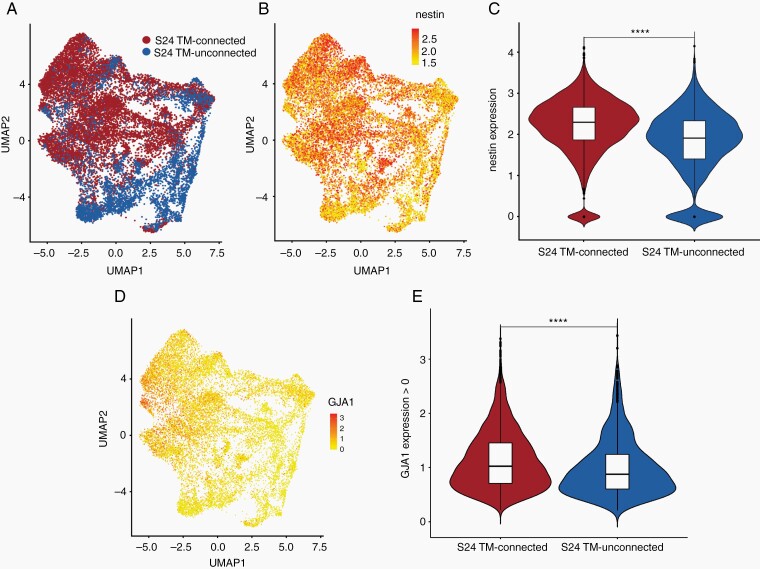
Single-cell transcriptome analysis of TM-connected and TM-unconnected tumor cells. A, UMAP (Uniform Manifold Approximation and Projection) visualization of TM-connected (red) and TM-unconnected (blue) S24 glioblastoma cells. B, Expression of nestin on UMAP from A. C, Violine blot showing the level of nestin expression in TM-connected and TM-unconnected S24 glioblastoma cells. D, UMAP visualization of single tumor cell GJA1 (Cx43) expression patterns. E, Violin blot of the expression of GJA1 (Cx43) in TM-connected and TM-unconnected S24 glioblastoma cells which show any detectable gene expression. ****P < .001.

