Fig. 4.
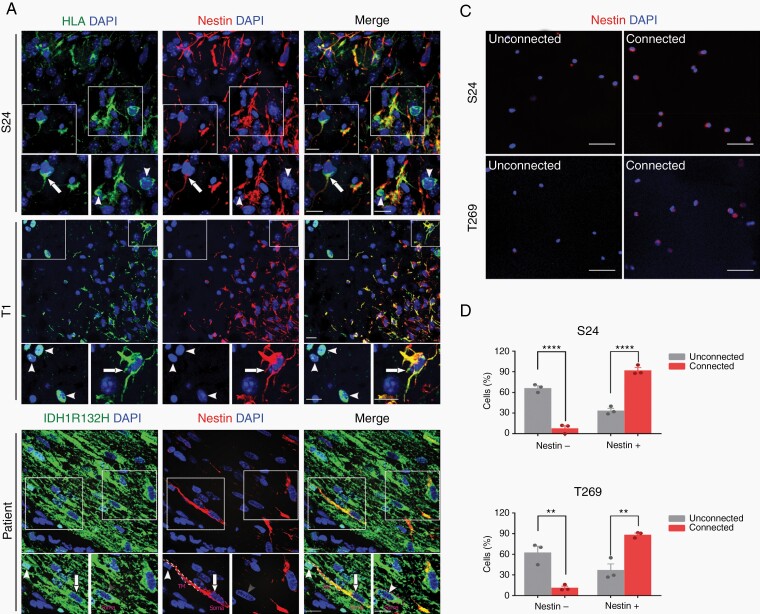
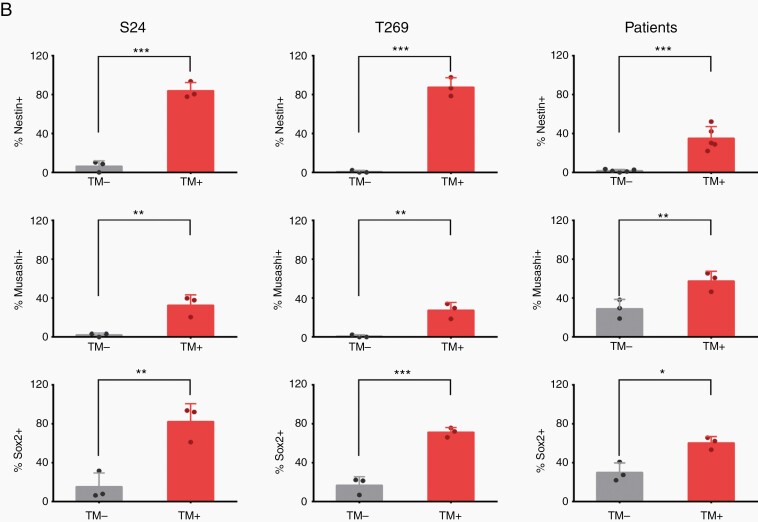
TM formation is associated with expression of nestin and other stem cell markers in glioma tissue. A, Representative nestin immunofluorescence images in glioma cells from implantation xenografts derived from primary tumor cell lines (S24, T1) and patient samples of IDH-mutated anaplastic astrocytoma or glioblastoma. HLA and highly tumor cell-specific IDH1R132H stainings (green) were used to clearly identify tumor cells in mouse and human samples: Nestin (red), DAPI (blue). Exemplary, TM-positive glioma cells are marked with arrows, TM-negative cells with arrowheads. Scale bars, 50 µm. B, Percentage of tumor cells with identifiable TMs in histological sections (TM+) vs those tumor cells where no TMs were identified (TM−) with respect to detectable immunohistochemical expression of nestin, Musashi and Sox2. C, Representative images of nestin immunofluorescence staining of FACS-sorted, TM-connected (SR101high, GFPhigh) vs -unconnected (SR101low, GFPlow) tumor cells from CSC xenograft glioma models. Please note that after FACS sorting, cells were directly stained without preculture and are thus always rounded and isolated, so TM proficiency/interconnectivity cannot be analyzed. Nestin (red), DAPI (blue). D, Quantification of detectable nestin protein expression of both groups (shown in C). Two-tailed unpaired Student’s t test (B) and two-way ANOVA with Tukey’s multiple comparisons test (D) were used. **P < .01, ***P < .001, ****P < .0001. Data are presented as the mean ± SD (B) or mean ± SEM (D) of n = 3-5 independent samples.


