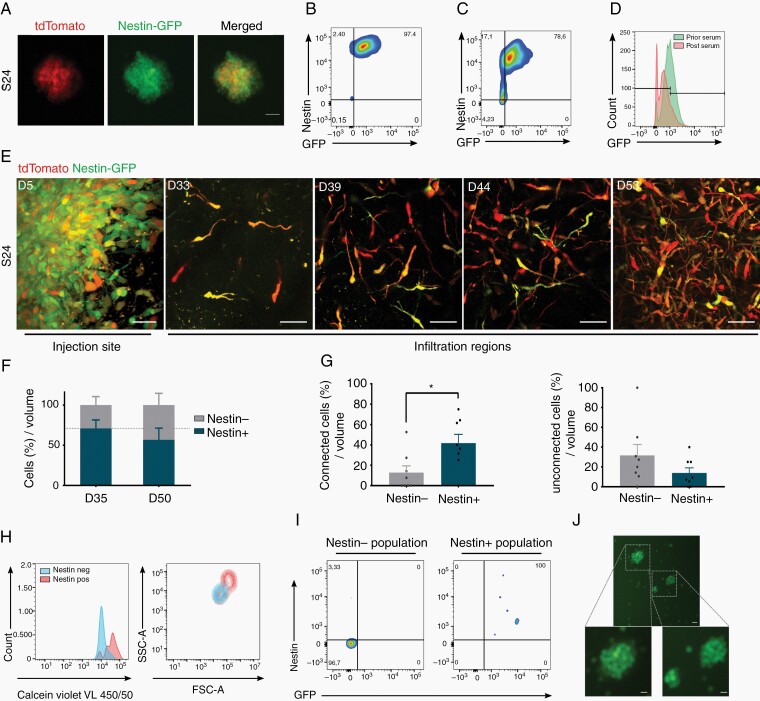
Fig. 5.
A reporter system for dynamic intravital tracking of nestin expression. A, S24-tdTomato cells cultured under stemness conditions in vitro express GFP driven by the nestin promoter. B-D, Relationship of GFP signal and in vitro nestin expression of tumor cells as determined by antibody staining. FACS analysis of tumor cells cultured under stemness condition (B), or after growth under differentiating serum-containing culture conditions for 1 week (C and D). E, Representative in vivo MPLSM images of S24 nestin reporter cells growing in the mouse brain in a tumor microregion over a period of 53 days. Nestin-GFP is shown in green, tdTomato is shown in red. Scale bars, 50 µm. F, Quantification of the relative change of tumor cell numbers in the same tumor microregions from Day 35 to Day 50, separately for the nestin+ (green and yellowish) and nestin− (red) tumor cell subpopulation. Dotted line represents the relative percentage value of nestin+ at Day 35. G, Relative fractions of connected nestin+ vs -nestin− subpopulations, and of unconnected nestin+ vs -nestin− subpopulations within tumor cells per volume at Day 35. H, Viability and morphology of nestin+ vs nestin− tumor cells at Day 57 of in vivo growth, analyzed by FACS. I, Relationship of GFP signal and in vivo nestin expression of tumor cells as determined by antibody staining. FACS analysis of GFP+ vs GFP− glioma cells from xenograft. J, Glioma cells that were nestin− (GFP−) after isolation from the mouse brain express GFP after re-exposition to stem-like culture conditions in vitro for 2 weeks. Scale bars, 20 µm. In F-H, one-way ANOVA with Tukey’s multiple comparisons test or two-way ANOVA with Sidak’s multiple comparisons test were used. *P < .05. Data presented as mean ± SEM of n = 7-12 tumor regions from 2-3 animals.

