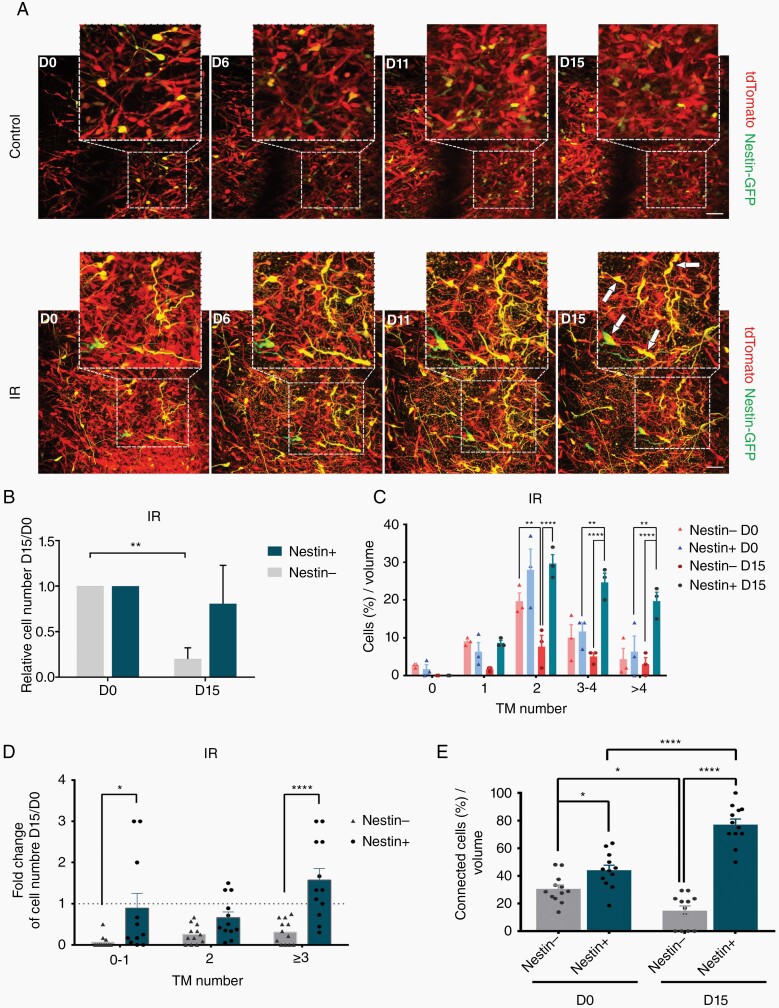
Fig. 6.
Response to radiotherapy correlates with in vivo nestin expression and network connectivity. A, Representative MPLSM images of dynamic, morphological, and gene expression changes of nestin reporter S24 glioblastoma cells in control (upper panel) and irradiated (3 × 7 Gy at Days 0-2; lower panel) tumors in the live mouse brain. Examples of nestin+/TM+ cells that survive radiation are marked with arrows. Scale bars, 100 µm. B, Relative cell numbers of nestin+ and nestin− S24 glioma cells in the same tumor microregion over 15 days vs Day 0 before radiation, respectively. C and D, Relative fractions of nestin+ vs nestin− tumor cells with TMs of 0, 1, 2, 3-4, and >4 per volume prior and post-irradiation (C), and relative change overview of nestin+ vs nestin− subpopulations with TMs of 0-1, 2, and ≥3 after radiation (D). E, Relative fractions of TM-connected nestin+ vs nestin− tumor cell subpopulations per brain volume prior and post-irradiation. In B-E, one-way ANOVA with Tukey’s multiple comparisons test or two-way ANOVA with Sidak’s multiple comparisons test were used. *P < .05, **P < .01, ***P < .001, ****P < .0001. Data are presented as mean ± SEM of n = 12 tumor regions from 3 mice per group.

