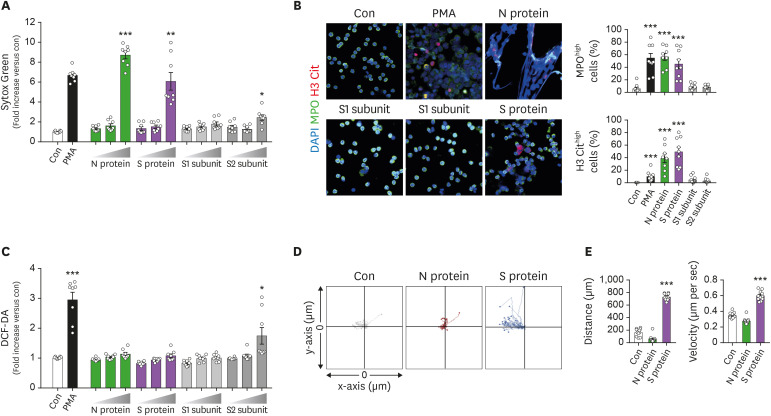
Figure 1. N and S proteins of SARS-CoV-2 induce NET formation from neutrophils. (A-C) Neutrophils were incubated with various concentrations (1, 10, and 100 nM) of the N protein, whole S protein, S1 subunits of the S protein, or S2 subunits of the S protein for 2 h. (A) NET formation in response to viral proteins was determined by Sytox Green staining. (B) Representative immunofluorescence images of NET formation in response to viral proteins of SARS-CoV-2. Representative images of more than 5 experiments are shown (scale bar, 10 μm). (C) ROS generation in response to viral proteins was determined by DCF-DA staining. (D, E) The effects of viral proteins on chemotaxis of neutrophils. One side of chamber was coated with either N, S, S1, or S2 protein and chemotaxis of neutrophils toward viral proteins was examined. (D) Neutrophil migration tracking analysis. The distances traveled by neutrophils were tracked for 45 min. Representative tracking results of thirty cells per each group are shown (n=3 per group). (E) Relative mean distance and relative mean velocity of neutrophils migrating toward viral proteins. Data are expressed as means±SEMs.
Con, control; MPO, myeloperoxidase; H3Cit, citrullinated histone 3.
*p<0.05; **p<0.01; ***p<0.001 vs. Con.

