Fig. 2.
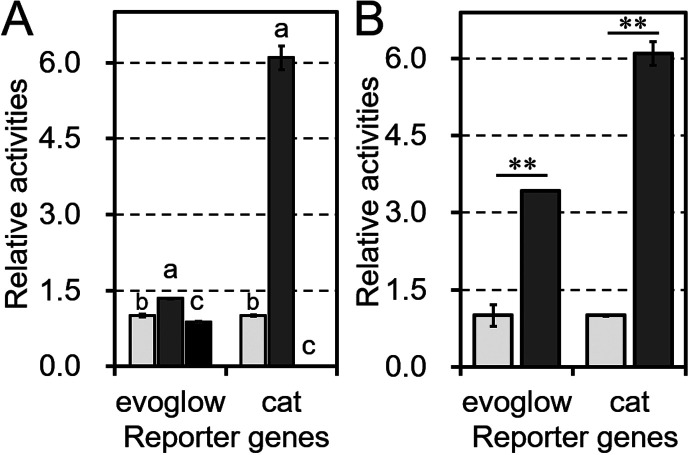
Comparison of the performance of the chloramphenicol acetyltransferase (CAT) and evoglow-Bs2 assays.
A: Relative activity levels in the CAT and evoglow-Bs2 assays. Tested transformants carried a cat reporter gene driven by either Pgap (light-gray bars), PrpmB (dark-gray bars), or the promoter-less pBCMAT or pBIFGLOW vectors (black bars), which were used to measure background levels. All plasmids were transformed into B. longum NCC2705. B: Relative activities after subtracting the background. The results are shown relative to those obtained with Pgap, which was set as 1. Values are presented as means ± SD. The assays were performed on the extracts of three independent bacterial cultures. Statistically distinguishable differences between two samples were evaluated by Student’s t-test (**p<0.01). Different letters indicate statistically distinguishable groups (p<0.05; Tukey’s multiple-comparison test).

