
Figure 3:
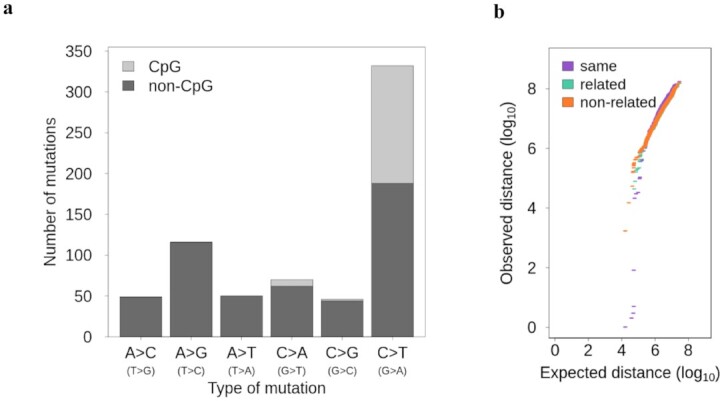
Characterizations of the de novo mutations. (a) The type of de novo mutations in CpG and non-CpG sites. (b) QQ-plot of the distance between de novo mutations compared to a uniform distribution within individuals (purple), between related individuals (green), and between non-related individuals (orange).