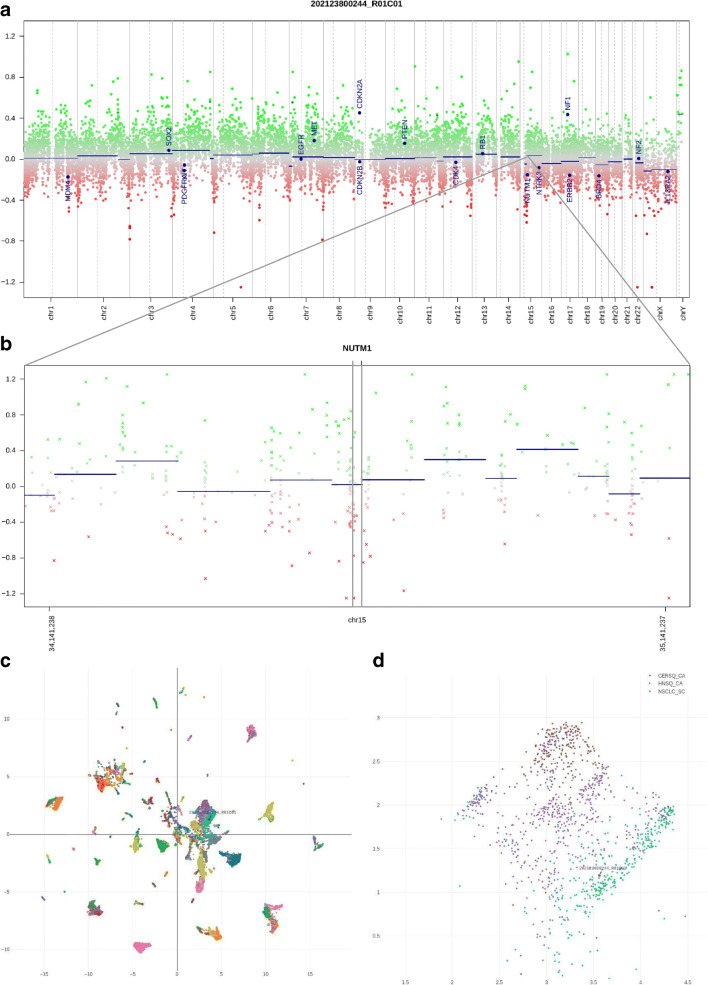
Fig. 2.
a Genome-wide copy number plot calculated from microarray data. The level of the blue dot labeled NUTM1 represents the average copy number for all NUTM1 probes. b Magnified plot around and including NUTM1 (center, black box). Note the partial loss (LOH) to the left of the NUTM1 locus, also including some of the NUTM1 probes. c Overview of the UMAP plot for > 15,000 reference samples; patient sample highlighted by an arrow and array ID. This respective cluster of samples mainly comprises carcinomas of various lineages. d Magnification from c. The tumor localizes in a sub-cluster containing cancers with squamous cell differentiation. Within this cluster, the similarity is highest to squamous cell cancers (SCCs) of the lung. Abbreviations of the color legend for methylation classes: CERSQ_CA cervical SCC, HNSQ_CA head and neck SCC, NSCLC_SC lung SCC

