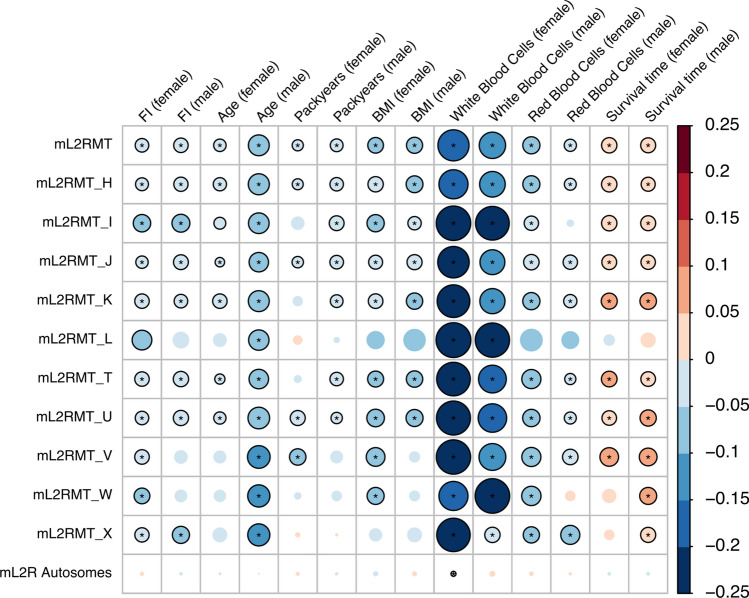
Fig. 1.
Association between mitochondrial DNA abundance and different covariates. The size and colour (see colour bar) of the circle represent the slope of the association of seven features with mitochondrial (mL2RMT) as well as autosomal DNA abundance (mL2R Autosomes), stratified by sex (for the precise effect sizes see also Supplementary Table S2). The associations were also analysed separately by major MT haplogroup (labelled H–X). Correlations which were statistically significant (Q value < 0.05) are indicated with an asterisk. Nominally significant associations (P value < 0.05) are shown as circles with black borders. FI frailty index, BMI body mass index, mL2RMT median log 2 ratio of mitochondrial probes; survival time, time till death or end of follow-up

