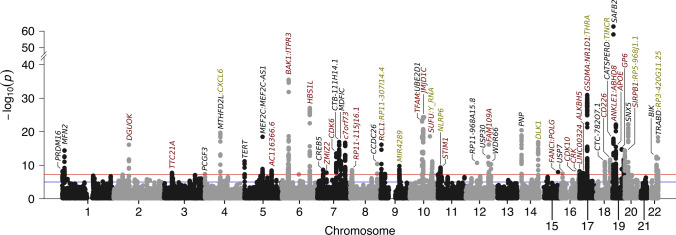
Fig. 3.
Summary of the genome-wide association study of mtDNA abundance. Manhattan plot of 3,505,788 variants with minor allele frequency greater 5%. Genes influenced by associated variants are highlighted in different colours: genes in red harbour exonic variants, genes which have associated variants in the intronic region are shown in black. In case no intronic or exonic variants are mapped to genes in a region, we highlighted the closest gene in green. The red line denotes genome-wide significance (P < 5.00 × 10–08) while the blue line denotes suggestive evidence for association (P < 1.00 × 10–05). The estimated genomic inflation factor λ was 1.147

