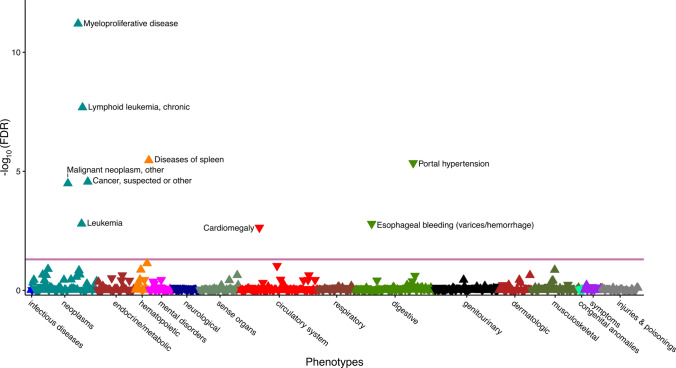
Fig. 4.
Phenome-wide association study of mtDNA abundance. The consequence of altered mtDNA abundance on 1150 incident diseases or traits determined from the hospital episode spell data was evaluated in all UK Biobank participants (detailed association results are presented in Supplementary Table S8). ICD10 diagnoses were mapped to phecodes and the association between discretized mtDNA abundance (in tertiles) and the phecodes was estimated with logistic regression, adjusted for age at baseline, genotyping batch, total autosomal DNA abundance, fraction of neutrophils, fraction of lymphocytes, white blood cell count, sex, BMI and smoking at baseline as well as the first two principal components of ancestry. Only phecodes with more than 250 cases were considered. Statistically significant associations (Q value < 0.05) are shown above the red line. Triangles facing up indicate increased risk while triangle pointing down indicate reduced risk to due elevated mtDNA abundance

