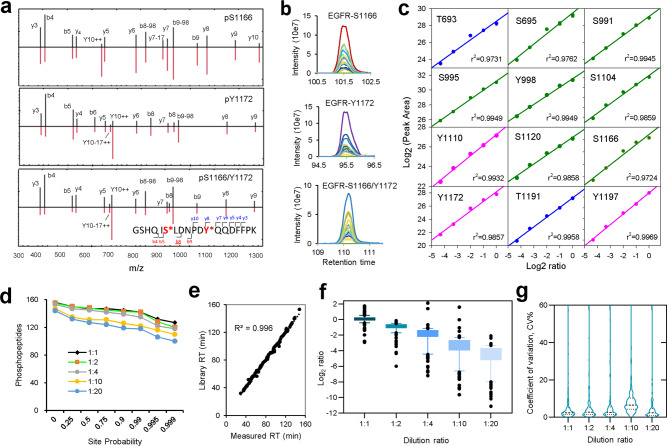
Fig. 2. Quantification performance benchmarking using synthetic phosphopeptides.
Pooled samples of 166 synthetic phosphopeptides with serial dilutions (2, 1, 0.5, 0.2, and 0.1 ng) spiked into 0.5 µg yeast tryptic peptides was used to benchmark phosphoproteome workflow generating spectral library. a Example DIA spectra of mono- and multiple phosphosites on the 1161GSHQISLDNPDYQQDFFPK1179 sequence from EGFR. Spectra matching the DIA signal (top, black line) and fragments in the library (bottom, red line) are shown. b Chromatographic elution profiles of the three phosphopeptides providing unambiguous detection. c Quantification linearity of 12 EGFR phosphosites across dilution series using site abundance against expected theoretical dilution ratio. d Localization probability distribution for the quantified 157 phosphopeptides in DIA scanning m/z range. Overall, among 157 phosphopeptides, 147 (93.6%), 145 (92.4%), 142 (90.4%), 131 (83.4%), and 124 (79%) were quantified as class 1 (minimum of 0.75 site-localization probability) in 1:1, 1:2, 1:4, 1:10, and 1:20 dilutions, respectively. e Correlation between measured retention time in DIA and expected time from library. f Quantification accuracy of class 1 localized phosphosites across dilution series. Box and whiskers were drawn with 10–90% percentile from n = 3 measurements. Median ratio of 0.95, 1.79, 3.36, 8.7, and 20.06 were observed for the theoretical ratio of 1-, 2-, 4-, 10-, and 20-fold, respectively. g Violin plot of distribution of coefficient of variation (CV %) of class 1 quantified phosphosites where the quartiles were shown using dot lines. A median CV% of 2.40%, 2.78%, 2.70%, 6.59%, and 2.46% were observed for phosphosites across 1:1, 1:2, 1:4, 1:10, and 1:20 dilution series, respectively. Source data are provided as a Source Data file.

